
- Title
-
Development and Characterization of an Endotoxemia Model in Zebra Fish
- Authors
- Hsu, A.Y., Gurol, T., Sobreira, T.J.P., Zhang, S., Moore, N., Cai, C., Zhang, Z.Y., Deng, Q.
- Source
- Full text @ Front Immunol

Zebra fish intravenous (IV) injection plate design and IV lipopolysaccharide (LPS) injection. (A) Illustration of the zebra fish IV injection plate. (B) A representative image of zebra fish larvae at 3 days post fertilization injected with PBS containing 1% Phenol Red. Scale bar: 500 µm. (C) Survival curve of zebra fish after PBS or 10, 15, and 25 ng LPS IV injection. One representative experiment of three independent biological repeats (n > 20 each group) is shown. **p < 0.01, ****p < 0.0001, Gehan–Breslow–Wilcoxon test. (D) Representative images of zebra fish larvae injected with PBS or LPS at 8 hours post injection (hpi). Scale bar: 500 µm. Boxed regions of the pericardium and tail fin are enlarged. Scale bar: 200 µm. Images representative of three independent experiments are shown (n = 20). (E) Percentage of fish with tail fin edema, pericardial edema, and circulation obstruction in PBS- or LPS-injected larvae at 8 hpi. Results are presented as mean ± SD (n = 3 independent experiments with over 20 larvae each/experiment). ***p < 0.001, ****p < 0.0001, Mann–Whitney test. (F,G) Representative images and quantification of inflammatory phenotypes in LPS- or PBS-injected larvae as (D,E) at 24 hpi. PHENOTYPE:
|
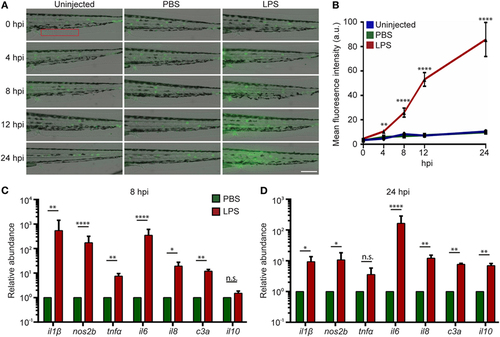
Intravenous (IV) lipopolysaccharide (LPS) activates NF-κB pathway and elicits a systemic immune response. (A) Tg(NF:κB:GFP) larvae were IV injected with PBS, LPS, or left uninjected. Representative images of GFP signals at indicated time points post injection. Images representative of three independent experiments were shown (n = 20). Scale bar: 200 µm. (B) Quantification of the GFP intensity in the caudal fin region (red box in Figure 2A). Results are presented as mean ± SD (D) (n = 3 independent experiments with over 20 larvae each/experiment). **p < 0.01, ****p < 0.0001, Kruskal–Wallis test. (C,D) Transcript levels of genes encoding pro-inflammatory and anti-inflammatory cytokines in whole larvae injected with either PBS or LPS at 8 hpi (C) and 24 hpi (D). Results were normalized with ef1α and are presented as means ± SD (n = 3 biological repeats with 20 larvae in each group). *p < 0.05, **p < 0.01, ***p < 0.001, ****p < 0.0001, Sidak’s multiple comparisons test. EXPRESSION / LABELING:
PHENOTYPE:
|
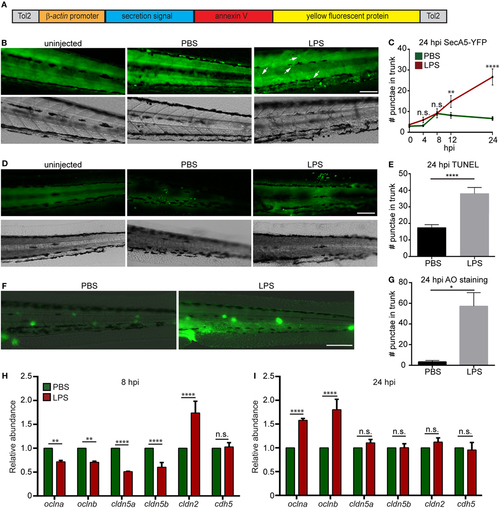
Lipopolysaccharide (LPS) induces tissue damage. (A) Diagram of the construct used to generate the apoptosis reporter line where a secreted AnnexinV tagged with a YFP protein is driven by the β-actin promoter. (B,C) Tg (β-actin:secANV-YFP) were injected with PBS or LPS. Representative images (B) and quantification (C) of the YFP-positive foci in trunks at indicated time points post injection. (D–G) WT zebra fish larvae were injected with PBS or LPS. Representative images (D) and quantification (E) of terminal deoxynucleotidyl transferase-mediated dUTP-biotin Nick End Labeling (TUNEL)-positive cells in the trunk at 24 hours post injection (hpi). Representative images (F) and quantification (G) of the Acridine Orange (AO)-positive cells in the trunk at 24 hpi Scale bar: 100 µm. Results are presented as mean ± SEM (n = 3 independent experiments with over 20 larvae each/experiment). *p < 0.05, ****p < 0.0001, Mann–Whitney test. (B,D,F) Images representative of three independent experiments were shown (n = 20). (H,I) Transcript levels of genes encoding vascular and cell junction proteins in whole larvae injected with either PBS or LPS at 8 hpi (H) and 24 hpi (I). Results were normalized with ef1α and are presented as means ± SD (D) (n = 3 biological repeats with 20 larvae in each group). **p < 0.01, ***p < 0.001, ****p < 0.0001, Sidak’s multiple comparisons test. EXPRESSION / LABELING:
PHENOTYPE:
|
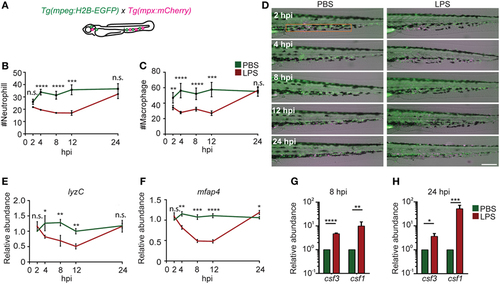
Immune cell mobilization and emergency hematopoiesis induced with lipopolysaccharide (LPS) injection. (A). Tg(mpeg:H2B-GFP) fish were crossed with Tg(mpx:mCherry) label macrophages (green) and neutrophils (red). The quantification of neutrophil (B) and macrophage (C) numbers and representative images (D) in the caudal hematopoietic tissue (CHT) (orange box) after PBS or LPS injection. Images representative of three independent experiments were shown (n = 20). Scale bar: 200 µm. (E,F) mRNA level of lyzC (E) and mfap4 (F) in the whole larvae injected with PBS or LPS. Results were normalized with ef1α and are presented as means ± SD (D) (n = 3 independent experiments with over 20 larvae each/experiment). *p < 0.05, **p < 0.01, ***p < 0.001, ****p < 0.0001, Mann–Whitney test. (G,H) mRNA level of csf3 and csf1 in whole larvae injected with PBS or LPS at 8 hpi (G) and 24 hpi (H). Results were normalized with ef1α and are presented as means ± SD (n = 3 biological repeats with 20 larvae in each group). *p < 0.05, **p < 0.01, ***p < 0.001, ****p < 0.0001, Mann–Whitney test. EXPRESSION / LABELING:
PHENOTYPE:
|
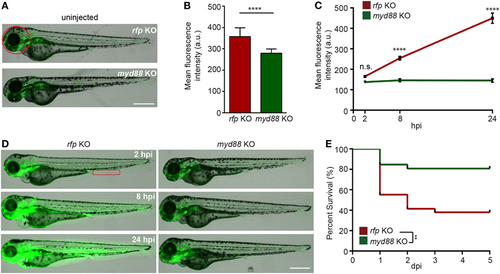
Knockout of MyD88 dampens NF-κB activation and reduced mortality in the zebra fish endotoxemia model. Zebra fish embryos of Tg(NF:κB:GFP) were injected with sgRNA against myd88 or rfp at the single-cell stage. (A,B) Representative images (A) and quantification (B) of the GFP intensity in the head (red circle) of uninjected 3dpf larvae. Scale bar: 500 µm. Results are presented as mean ± SD (D) (n = 3 independent experiments with over 20 larvae each/experiment). ****p < 0.0001, Mann–Whitney test. (C,D) myd88 or rfp KO larvae were injected with LPS. Quantification of NF-κB activity (C) and representative images (D) of the GFP intensity in the Tg(NFκB:GFP) background in the indicated region (red box). Scale bar: 500 µm. Results are presented as mean ± SD (n = 3 independent experiments with over 20 larvae each/experiment). ****p < 0.0001, Kruskal–Wallis test. (E) Survival curve of myd88 or rpf KO larvae injected with LPS. One representative experiment of three independent biological repeats (n = 20 each group) is shown. **p < 0.01, Gehan–Breslow–Wilcoxon test. PHENOTYPE:
|
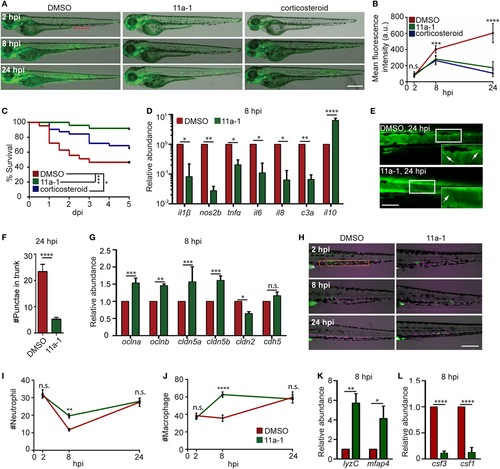
Shp2 inhibitor reduces lipopolysaccharide (LPS)-induced systemic inflammation and mortality. (A,B) Zebra fish embryos of Tg(NF:κB:GFP) were treated with DMSO, Shp2 inhibitor (11a-1), or corticosteroids and injected with LPS. Representative images (A) and quantification (B) of the GFP intensity in the indicated region. Scale bar: 500 µm. Results are presented as mean ± SD (D) (n = 3 independent experiments with over 20 larvae each/experiment). ***p < 0.001, ****p < 0.0001, Kruskal–Wallis test. (C) Survival curve LPS-injected larvae treated with DMSO, 11a-1, or corticosteroid. One representative experiment of three independent biological repeats (n = 20 each group) is shown. *p < 0.05, ***p < 0.001, Gehan–Breslow–Wilcoxon test. (D) Transcript levels of genes encoding pro-inflammatory and anti-inflammatory cytokines in whole larvae treated with DMSO or 11a-1 at 8 hpi. Results were normalized with ef1α and are presented as means ± SD (n = 3 biological repeats with 20 larvae in each group). *p < 0.05, **p < 0.01, ****p < 0.0001, Sidak’s multiple comparisons test. (E,F) Tg(β-actin:secANV-YFP)pu17 were treated with DMSO or 11a-1 and injected with LPS. Representative image (E) and quantification (F) of apoptotic cell puncta in the trunk. Scale bar: 200 µm. ****p < 0.0001, Mann–Whitney test. (G) Transcript levels of genes encoding vascular and cell junction proteins in whole larvae at 8 h post LPS injection treated with DMSO or 11a-1. Results were normalized with ef1α and are presented as means ± SD (n = 3 biological repeats with 20 larvae in each group). **p < 0.01, ***p < 0.001, Sidak’s multiple comparisons test. (H–J) Tg(mpeg:H2B-GFP) were crossed with Tg(mpx:mCherry), treated with DMSO or 11a-1 and injected with LPS. Representative images (H) and quantification of neutrophil (I) and macrophage (J) numbers in the caudal hematopoietic tissue (orange box). One representative result of three independent experiments was shown (n = 20). Scale bar: 200 µm. Results are presented as mean ± SD (n = 3 independent experiments with over 20 larvae each/experiment). **p < 0.01, ****p < 0.0001, Mann–Whitney test. (K,L) Transcript levels of genes encoding lyzC and mfap4 (K), csf3 and csf1 (L) in whole larvae treated with DMSO or 11a-1 after LPS injection. Results were normalized with ef1α and are presented as means ± SD (n = 3 biological repeats with 20 larvae in each group). *p < 0.05, **p < 0.01, ****p < 0.0001, Mann–Whitney test. EXPRESSION / LABELING:
PHENOTYPE:
|
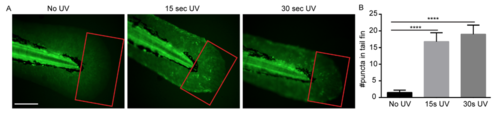
Characterization of Tg(βactin:secA5-YFP) line. (A) Tg(βactin:secA5-YFP) larvae at 3 dpf were subjected to either no UV, 15 sec, or 30 sec irradiation. (B) Quantification of puncta in the boxed region in tail fin. Scale bar: 100 µm. Results are presented as mean ± s.d. (N = 3 independent experiments with over 20 larvae each/experiment). ****, p<0.0001, Kruskal-Wallis test. |