
- Title
-
Activation of Hepatic Stellate Cells During Liver Carcinogenesis Requires Fibrinogen/Integrin αvβ5 in Zebrafish
- Authors
- Yan, C., Yang, Q., Gong, Z.
- Source
- Full text @ Neoplasia
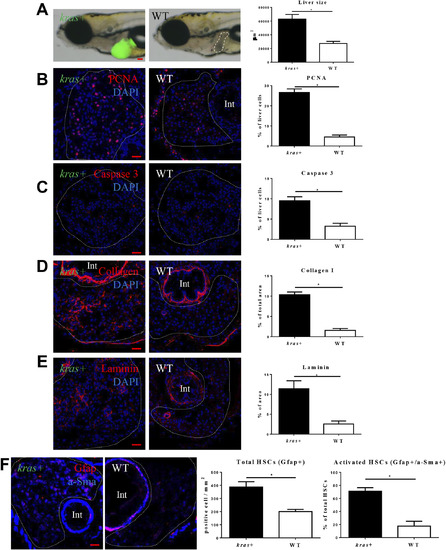
Characterization of krasV12-induced hepatocarcinogenesis in zebrafish larvae. 3-dpi kras+ or WT larvae were treated with 20 μg/ml for 4 days. More than 20 larvae were analyzed in each group. (A) Gross morphology of kras+ or WT larvae after 4 days induction (left lateral view). krasV12 expressing liver is marked by GFP expression and WT liver is outlined. Quantification of 2D liver size was shown in the right panel. (B-E) IF staining of PCNA (B), Caspase 3 (C), Collagen I (D) or Laminin (E) on liver sections of kras+ and WT larvae as indicated. Livers are marked by dash lines. Int indicates intestine. Quantifications of staining signals based on percentages of liver area are shown in the right panels. (F) IF co-staining of GFAP (red) and a-Sma (blue) on liver sections of kras+ and WT larvae as indicated. Quantifications of total HSC density based on Gfap+ cells and ratio of activated HSCs based on a-SMA staining in liver sections are presented on the right. *P < .05. Scale bars: 20 μm. |

Fibrinogen production and integrin αvβ5 expression in the liver. (A) IF staining of Fibrinogen on liver sections of kras+ and WT larvae. Livers in the WT picture is marked by a dash line. (B) Quantification of Fibrinogen-positive hepatocytes. (C) Fold change of expression of fibrinogen genes (fga, fgb an fgg) krasv12-expressing hepatocytes compared to WT hepatocytes. Integrin receptor, (D-E)expression of itgav (D) and itgb5 (E) mRNAs in hepatocytes and HSCs. Normal hepatocytes and HSCs were sorted by FACS based on DsRed and GFP expression from fabp10+ and hand2+ transgenic zebrafish respectively. Relative expression levels are shown with the value from hepatocytes arbitrarily set as 1. *P < .05. Scale bar: 20 μm. |

Effects of manipulation of integrin αvβ5 activity on HSC. 3-dpi kras+ and WT larvae were treated cilengitide or ADP together with dox for 4 days. Liver sections were stained for various molecular markers and more than 20 fish were analyzed in each group. (A) IF co-staining of Gfap (red) and a-SMA (blue). (B) Quantification of total HSC density. (C) Quantification of ratio of activated HSCs. (D) IF co-staining of Gfap (red) and Tgfb1 (blue). (E) Quantification of percentage of Tgfb1-expressing HSCs. (F) IF co-staining of Gfap (red) and Caspase 3 (blue). (G) Quantification of percentage of apoptotic HSCs. Livers are marked by dash lines. Int indicates intestine. *P < .05. Scale bar: 20 μm. |

Effects of manipulation of integrin αvβ5 activity on tumorigenesis. 3-dpi kras+ and WT larvae were treated cilengitide or ADP together with dox for 4 days. Liver size were measured and liver sections were stained for cell proliferation and apoptosis. More than 20 fish were analyzed in each group. (A) Gross morphology of larvae after 4 days of treatment (left lateral view). The WT livers were outlined. (B) Quantification of liver size. (C) IF staining of PCNA on liver sections. (D) Quantification of PCNA-positive cells in the liver. (E) IF staining of Caspase 3 on liver sections. (F) Quantification of Caspase 3-positive cells in the liver. Livers are marked by dash lines. Int indicates intestine. *P < .05. Scale bar: 20 μm. PHENOTYPE:
|
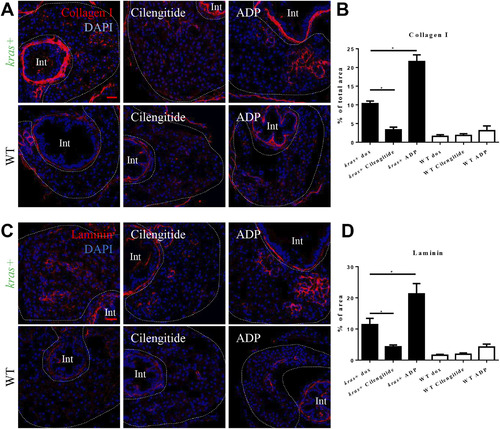
Effects of manipulation of integrin αvβ5 activity on progression of liver fibrosis. 3-dpi kras+ and WT larvae were treated cilengitide or ADP together with dox for 4 days. Liver sections were stained for fibrosis markers, Collagen I and Laminin. More than 20 fish were analyzed in each group. (A) IF staining of Collagen I on liver sections. (B) Quantification of percentage of Collagen I positive area in the liver. (C) IF staining of Laminin on liver sections. (D) Quantification of percentage of Laminin positive area in the liver. Livers are marked by dash lines. Int indicates intestine. *P < .05. Scale bar: 20 μm. PHENOTYPE:
|