
- Title
-
Myelination of Neuronal Cell Bodies when Myelin Supply Exceeds Axonal Demand
- Authors
- Almeida, R.G., Pan, S., Cole, K.L.H., Williamson, J.M., Early, J.J., Czopka, T., Klingseisen, A., Chan, J.R., Lyons, D.A.
- Source
- Full text @ Curr. Biol.
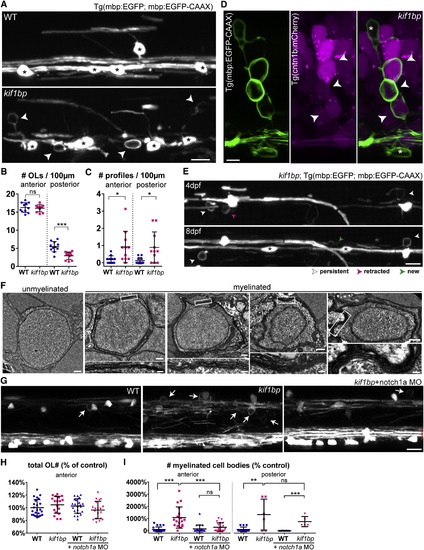
Oligodendrocytes in Excess of Target Axons Ectopically Myelinate Neuronal Cell Bodies in kif1bp Mutants (A) Double myelin and oligodendrocyte reporter showing oligodendrocytes (asterisks) and ectopic profiles (arrowheads) in the spinal cord (4 dpf). (B) Oligodendrocyte number (per 100 μm length of spinal cord) is normal in the anterior but reduced in the posterior spinal cord of kif1bp mutants (p = 0.688 anterior; p = 0.0001 posterior; n = 11 wild-type [WT] and n = 11 mutants; t test). (C) Profile number is increased in mutants (p = 0.018 anterior; p = 0.011 posterior; n = 11 WT and n = 11 mutants; t test). (D) Double myelin and neuronal reporter showing mCherry+ neurons enwrapped by EGFP+ myelin (arrowheads) in 4 dpf mutants. Asterisk, oligodendrocyte cell body. (E) Time course of double oligodendrocyte and myelin reporter in kif1bp mutant. Asterisks denote new oligodendrocytes. (F) Transmission electron microscopy (TEM) of a typical unmyelinated cell body and four myelinated cell bodies in 6 dpf mutants. (G) 4 dpf anterior spinal cord of oligodendrocyte and myelin reporter showing that increased ectopic profiles (arrows) in mutants are rescued by presence of additional Mauthner axons (red brackets) when injected with notch1a morpholino (MO). (H) Oligodendrocyte number (normalized to control average) is normal in all conditions (p[kif1bp-WT] = 0.267; p[WT+notch1a MO-WT] = 0.483; p[kif1bp+notch1aMO-WT] = 0.374; p[kif1bp+notch1aMO-kif1bp] = 0.071; n = 23 WT; n = 18 kif1bp; n = 22 WT+notch1a MO; n = 19 kif1bp+notch1a MO; t tests). (I) Myelinated cell body number (normalized to control average) is increased in mutants (p[WT-kif1bp] < 0.0001, n = 23 WT and n = 18 kif1bp anterior; p[WT-kif1bp] = 0.0019, n = 14 WT and n = 6 kif1bp posterior; t tests) and is rescued by additional Mauthner axons in anterior (p[kif1bp+notch1a MO-kif1bp] = 0.0008, n = 18 kif1bp and n = 19 kif1bp+notch1a MO; t test), but not posterior, spinal cord of mutants (p[kif1bp+notch1a MO-kif1bp] = 0.359, n = 6 kif1bp and n = 5 kif1bp+notch1a MO; t test). All graphs display mean and SD. OL, oligodendrocyte. The scale bars represent 10 μm (A, E, and G), 5 μm (D), 0.5 μm (F, whole cell), and 0.1 μm (F, myelin detail). See also Movies S1 and S2. |

Individual Oligodendrocytes in Excess of Target Axons Wrap Cell Bodies and Normal Axon Targets, but Not Incorrect Axons (A) Individual oligodendrocytes (mbp:EGFP-CAAX+) in the 4 dpf anterior spinal cord. Arrow, myelinated cell body; arrowheads, normal myelin sheaths; red outline, oligodendrocyte cell body. (B) Sheath number per oligodendrocyte is normal (p = 0.868 dorsal, n = 14 WT and n = 7 mutants; p = 0.118 ventral, n = 16 WT and n = 9 mutants; t tests). (C) Average sheath length per oligodendrocyte is reduced in mutants (p = 0.007 dorsal, n = 14 WT and n = 7 mutants; p = 0.013 ventral, n = 16 WT and n = 9 mutants; t tests). (D) Number of myelinated cell bodies per oligodendrocyte is increased in mutants (p = 0.009, n = 35 WT and n = 25 mutants; Mann-Whitney test). (E) Proportion of myelin sheaths target axonal tracts in mutants is comparable to wild-type. (F) TEM at the onset of myelination (3.5 dpf) focusing on the ventral region with reticulospinal axons (e.g., asterisks) and adjacent medial region with small-diameter (<0.3 μm) unmyelinated axons. (G) The smallest myelinated axons remain above 0.4 μm diameter (p[0.4–0.5μm] = 0.908; p[0.5–0.7] = 0.251; p[0.7–0.9] = 0.386; p[0.9+] = 0.782; n = 5 WT and n = 5 mutants; corrected t tests). (H–J) Single EGFP+ reticulospinal axons (H) co-expressing the myelination reporter tagRFPt-cntn1a showing more and shorter tagRFPt-cntn1a gaps (i.e., myelin sheaths, arrowheads) in the anterior spinal cord of mutants at 4 dpf, quantified in (I) (p = 0.003; n = 31 WT and n = 5 mutants; t test), and (J) (p = 0.005; n = 31 WT and n = 5 mutants; t test). (K) % axon myelinated (tagRFPt-cntn1a negative) is comparable to wild-types (p = 0.174; n = 31 WT and n = 5 mutants; t test). All graphs display mean and SD, except (D) (median and interquartile range). The scale bars represent 5 μm (A), 0.5 μm (F), and 10 μm (H). |
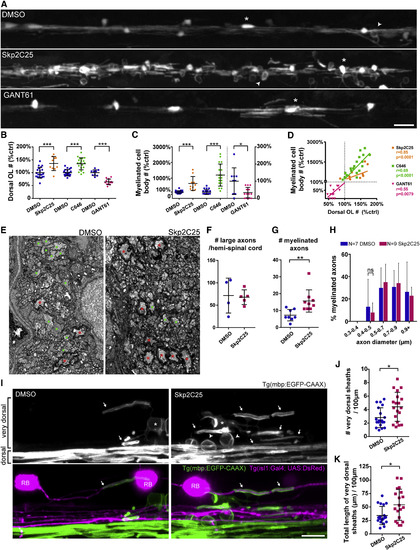
Increasing Oligodendrocyte Number Recapitulates Wrapping of Neuronal Cell Bodies (A) Double myelin and oligodendrocyte reporter (4 dpf), treated with vehicle DMSO, Skp2C25, or GANT61. (B and C) Oligodendrocyte (e.g., asterisk) number and myelinated cell bodies (e.g., arrowheads) number is increased in the dorsal spinal cord of Skp2C25-treated animals and reduced in GANT61-treated animals, quantified in (B) (p[Skp2C25-DMSO] = 0.0004, n = 20 DMSO and n = 10 Skp2C25; p[C646-DMSO] < 0.0001, n = 22 DMSO and n = 19 C646; p[GANT61-DMSO] < 0.0001, n = 9 DMSO and n = 13 GANT61; t tests; data normalized to control average) and in (C) (p[Skp2C25-DMSO] < 0.0001, n = 20 DMSO and n = 10 Skp2C25; p[C646-DMSO] < 0.0001, n = 22 DMSO and n = 19 C646; p[GANT61-DMSO] = 0.011, n = 9 DMSO and n = 13 GANT61; t tests; data normalized to control average; GANT61 data and its control plotted on right y axis), respectively. (D) Plotting all normalized data shows that myelinated cell body number positively correlates to oligodendrocyte number (Pearson’s r correlation and p value displayed for each treatment). (E) TEM of 4 dpf medial-dorsal spinal cord shows increased number of myelinated axons (red asterisks) in Skp2C25-treated animals whereas controls still have many unmyelinated large-caliber axons (green circles). (F) Total number of large-caliber (>0.5 μm diameter) axons in the medial-dorsal spinal cord is normal in Skp2C25-treated animals (p = 0.852; n = 4 DMSO and n = 5 Skp2C25; t test). (G) Myelinated axon number is increased with Skp2C25 (p = 0.006; n = 8 DMSO and n = 9 Skp2C25; t test). (H) Smallest myelinated axons in Skp2C25-treated animals remain above 0.4 μm diameter (p = 0.961 for all bin comparisons; n = 7 DMSO and n = 9 Skp2C25; corrected t tests). (I) 4 dpf double myelin and Rohon-Beard (RB) neuron reporter (Tg(isl1(ss):Gal4; UAS:DsRed)), focusing in the dorsal spinal cord. (J and K) Skp2C25-treated animals have more “very dorsal” myelin sheaths (arrows), quantified in (J) (p = 0.011; n = 19 DMSO and n = 19 Skp2C25; t test), which add up to a higher total myelin sheath length, quantified in (K) (p = 0.013; n = 19 DMSO and n = 19 Skp2C25; t test), as well as readily identifiable myelinated cell bodies (arrowheads). Examples of very rare myelin sheaths on dsRed+ large-caliber RB axons (arrows in merged panels), which are not increased with Skp2C25 (see main text for details), are shown. All graphs display mean and SD. The scale bars represent 20 μm (A) and 10 μm (I). See also Figure S1. |

Increasing Myelin Production Induces Cell Body Wrapping in the Zebrafish and Mouse Spinal Cord (A) 5 dpf spinal cord of control and transgenic zebrafish overexpressing constitutively active human Akt1 in oligodendrocytes, Tg(mbp:hAkt1DD), in double oligodendrocyte and myelin reporter line (arrowheads, wrapped cell bodies; asterisks, oligodendrocytes). (B) The number of wrapped cell bodies is significantly increased in Tg(mbp:hAkt1DD) (p = 0.001; n = 25 control and n = 14 Tg(mbp:hAkt1DD); t test). (C–F) Individual oligodendrocytes (C; asterisks note their cell bodies; note cytoplasmic TagRFPt expression in Tg(mbp:hAkt1DD) cell in inset) have a similar myelin sheath number and length at 5 dpf, quantified in (D) (p = 0.077; n = 16 control and n = 25 Tg(mbp:hAkt1DD); t test) and (E) (p = 0.412; n = 16 control and n = 25 Tg(mbp:hAkt1DD); t test), but Tg(mbp:hAkt1DD) animals have more myelinated cell bodies (arrowheads), quantified in (F) (p = 0.011; n = 21 control and n = 30 Tg(mbp:hAkt1DD); Mann-Whitney test). (C’) Another example of an individual oligodendrocyte in Tg(mbp:hAkt1DD) showing ectopic myelination of multiple cell bodies (arrowheads; asterisk denotes oligodendrocyte cell body). (G) Immunostaining of myelin basic protein (red, MBP) and NeuN (magenta) in the dorsal horn of the cervical spinal cord. Arrowhead indicates a wrapped NeuN+ neuronal cell body. (H) Optical sections representing 1-μm increments in the axial plane. Rightmost panel is a maximum intensity projection of MBP. (I) Frequency of ectopic wrapping events is slightly increased in the cervical spinal cord of P30 PTENfl/fl; CNP-Cre transgenic mice (p = 0.029; Mann-Whitney test; n = 4 animals per genotype; each animal quantified as the median of 6 pooled histological sections). All graphs display mean and SD, except for (F) and (I), which display median and interquartile range. The scale bars represent 10 μm (A), 5 μm (C and C’), 1 μm (inset C), 50 μm (G), and 20 μm (H). |

Wrapping of cell bodies in Skp2C25 treated animals, related to Figure 3. (A). Skp2C25- treated double transgenic animals with a fluorescently labelled Rohon Beard neuron Tg(cntn1b:mCherry) wrapped in myelin by a Tg(mbp:EGFP-CAAX) expressing myelinating oligodendrocyte. (B) Skp2C25-treated double transgenic animals with fluorescently labelled neurons Tg(NBT:dsRed) wrapped in myelin. Right shows a second example at higher magnification. |