
- Title
-
Transient fibrosis resolves via fibroblast inactivation in the regenerating zebrafish heart
- Authors
- Sánchez-Iranzo, H., Galardi-Castilla, M., Sanz-Morejón, A., González-Rosa, J.M., Costa, R., Ernst, A., Sainz de Aja, J., Langa, X., Mercader, N.
- Source
- Full text @ Proc. Natl. Acad. Sci. USA

Intracardiac fibroblasts contribute to transient fibrosis during zebrafish heart regeneration. (A and B) Transcriptome analysis of wt1a:GFP+ cells isolated from adult zebrafish hearts. (A) Ingenuity pathways enriched in wt1a:GFP+ ventricular cells compared with all GFP− cells. A number of differentially expressed genes are shown; the x axis shows −log10[Benjamini–Hochberg adjusted (B.H.) P values]. (B) Heatmap indicating up-regulation of fibrotic marker genes (underlined) in the wt1a:GFP+ cell fraction. (C–F) postnb mRNA in situ hybridization followed by anti-GFP immunohistochemistry on sections of wt1a:GFP ventricles without injury (C and D) and at 7 d postinjury (E and F). Arrowheads indicate wt1a:GFP+ cells. (G–P) Immunofluorescence staining of sections of wt1a:GFP;col1a2:mCherry-NTR double-transgenic hearts without injury (G–K) or at 7 dpi (L–P). Red arrowheads mark col1a2:mCherry+ cells; green arrowheads mark wt1a:GFP+ cells; and yellow arrowheads mark double-positive cells. Asterisk in L indicates injured area. (Q and R) FACS-sorted cells from the wt1a:GFP;col1a2:mCherry ventricular apex without injury (Q) or at 7 dpi (R). Representative examples from a total of four hearts per condition were analyzed. (S) The percentage of wt1a:GFP+ cells that express more than 1,000 a.u. of mCherry, with the threshold corresponding to the maximum value of mCherry detected in nonactivated fibroblasts. (T) The percentage of col1a2:mCherry+;wt1a:GFP+ cells according to the thresholds shown in R. Graphs show individual measurements and means ± SD. ****P < 0.0001 by two-tailed t test. at, atrium; ba, bulbus arteriosus; v, ventricle. [Scale bars, 25 μm (H, I, M, and N), 50 μm (C–F), and 100 μm (G and L).] |

Endocardium-derived cells contribute to transient fibrosis during zebrafish heart regeneration. (A) Analysis of the transcriptome of kdrl:mCherry+ cells FACS-sorted from the ventricular apex of hearts with no injury or at 7 dpi was performed. Volcano plot. Light blue, false discovery rate (FDR) >0.05, abs[log fold change (LFC)] <1; orange, FDR >0.05, abs(LFC) >1; green, FDR <0.05, abs(LFC) >1. (B) Ingenuity pathway analysis including the number of differentially expressed genes. (C–F) Immunofluorescence with anti-GFP and anti-mCherry of a heart section from an adult fli1a:GFP;col1a2:mCherry-NTR zebrafish. Yellow arrowheads mark double-positive cells at the injury area (IA; asterisk). Green arrowheads mark fli1a:GFP+ cells negative for mCherry. (G and H) FACS-sorted cells from fli1a:GFP;col1a2:mCherry hearts without injury or at 7 dpi. Shown are two representative examples from a total of four hearts per condition analyzed. (I) The percentage of fli1a:GFP+ cells that express more than 100 a.u. of mCherry, with the threshold corresponding to the maximum value of mCherry detected in endocardial cells from uninjured hearts. (J) The percentage of col1a2:mCherry+;fli1a:GFP+ cells according to the thresholds in H. Graphs show individual measurements from hearts as well as mean ± SD values. *P = 0.0363 by two-tailed t test. (K) Experimental scheme for visualizing collagen-producing endocardial cells. (L–N) Immunostaining of a heart section close to the IA. M is a zoomed-in view of L. (N and O) Zoomed-in views of M. mCherry marks fli1a-derived cells expressing col1a2, myosin heavy chain (MHC) marks the myocardium, and nuclei are DAPI-counterstained. [Scale bars, 25 µm (D, M, and N) and 100 µm (C and L).] |

periostin b expression marks an activated cardiac fibroblast population upon ventricular cryoinjury. (A–E) Whole-heart immunofluorescence in the postnb:citrine; fli1a:dsRedEx double-transgenic line. Whole-heart (A) and zoomed-in views (B and C) of the ventricular apex of an uninjured heart and a heart at 7 dpi (D and E). Perivascular cells can be observed in C. postnb:citrine, green; fli1a:dsRedEx, red. (F and G) Immunofluorescence staining of a sagittal heart section of a postnb:citrine;kdrl:mCherry zebrafish (F). Asterisk in F marks the injury area. (G) Zoomed-in view of the injured ventricular apex. postnb:citrine, green; kdrl:mCherry, red. (H) Quantification of proliferating postnb+ cells postinjury (mean ± SD; ****P < 0.0001, **P < 0.01 by one-way ANOVA followed by Tukey’s multiple comparisons test). (I) FACS-sorted cells from kdrl:mCherry;postnb:citrine hearts. No double-positive cells were detected. (J and K) Transcriptome analysis of postnb:citrine+ cells isolated from the ventricular apex. (J) Ingenuity pathway analysis. The x axis shows −log10(B.H. P values). (K) Volcano plot. Light blue, FDR >0.05, abs(LFC) <1; orange, FDR <0.05, abs(LFC) <1; green, FDR <0.05, abs(LFC) >1. [Scale bars, 25 µm (B, C, E, and G) and 100 µm (A, D, and F).] |

Persistence of postnb-derived cells in the regenerated myocardium. (A) 4-Hydroxytamoxifen was added to postnb:CreERT2;ubb:Switch fish at 3 and 4 dpi, and hearts were dissected at different dpi. (B–I) Immunofluorescence staining of heart sections at 7 (B–E) or 90 dpi (F–I). (J) Percentage of postnb-derived cells at the injury area. Symbols show individual measurements, and boxes and whiskers show mean ± SD; **P = 0.0064 by two-tailed unpaired t test. (K–M) postnb-derived mCherry+ cells were sorted from the ventricular apex at 7 and 60 dpi, and transcriptome analysis was performed on isolated mCherry+ cells. (K and L) Ingenuity pathway analysis. Bars represent pathways enriched in postnb-derived cells compared with the remainder of cells in the injury area at 7 and 60 dpi. Numbers of differentially expressed genes are indicated. The x axis shows −log10(B.H. P values). (M) Volcano plot. Light blue, FDR >0.05, abs(LFC) <1; orange, FDR >0.05, abs(LFC) >1; green, FDR <0.05, abs(LFC) >1. (N) Heatmap of the top 200 differentially expressed genes between 7 and 60 dpi in postnb-traced cells and their expression in wt1a:GFP+ cells from uninjured hearts. [Scale bars, 25 µm (C–E and G–I) and 100 µm (B and F).] |

Genetic ablation of collagen 1a2-expressing cells impairs cardiomyocyte proliferation in the cryoinjured heart. (A) col1a2:mCherry-NTR adult animals were cryoinjured and treated with metronidazole (Mtz) from 4 to 6 dpi. BrdU injection was performed 1 d before fixation. (B–G) Immunofluorescence using anti-mef2 and anti-MHC to mark cardiomyocytes, and anti-BrdU in col1a2:loxP-tagBFP-loxP-mCherry-NTR (control) and col1a2:mCherry-NTR fish treated with Mtz and BrdU as described in A. Arrowheads mark BrdU+ cardiomyocytes. (H) Quantification of BrdU+ cardiomyocytes in col1a2:mCherry-NTR and control hearts. Shown are individual measurements and median ± interquartile range; ***P = 0.0004 by Mann–Whitney test, n = 23 fish per condition, from two different experiments (blue and red dots). Three whole-heart ventricle sections were quantified per point. [Scale bars, 10 µm (C and E–G) and 100 µm (B and D).] |

col1a2:mCherry-NTR transgenic line allows the labeling of collagen-producing cells, and wt1a-derived cells express col1a2 after cryoinjury. (A) Immunofluorescence of heart sections with anti-col1a1 (green) and mCherry (red). Nuclei are counterstained with DAPI. (B–E) Merged and individual channels of the boxed area in A. Arrowheads mark mCherry+ cells that are surrounded by col1a1. (F–N) Lineage tracing of wt1a+ cells. (F) 4-Hydroxytamoxifen (4-OHT) was added to adult wt1a:CreERT2;ubb:Switch uninjured fish 10 and 9 d before dissection. (G–N) Immunofluorescence staining with anti-col1a1 (green) and mCherry (red) of heart sections of uninjured hearts (G–J) or 7 d postinjury (dpi) hearts (K–N). Nuclei are DAPI-counterstained (blue). Arrowheads mark wt1a-derived cells. (O) Experimental scheme for tracing the fate of wt1a-derived cells expressing col1a2. The wt1a:CreERT2 line was crossed with the col1a2:loxP-tagBFP-STOP-loxPmCherry- NTR line, in which mCherry-NTR is not expressed. Upon 4-OHT administration, recombination of loxP sites leads to activation of mCherry expression under the control of a col1a2 promoter. Hearts from animals at 7 dpi were dissected and sectioned. (P–S) Immunofluorescence of heart sections with antimyosin heavy chain (MHC; green), and mCherry (red). Nuclei are counterstained with DAPI. (Q–S) Merged and individual channels of the boxed area in P. Arrowheads mark mCherry+ cells, which express col1a2. ba, bulbus arteriosus; v, ventricle. [Scale bars, 25 μm (B, G, H, K, L, and Q) and 100 μm (A and P).] |

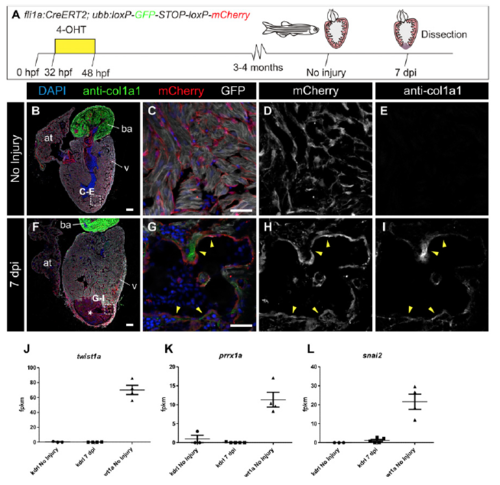
Resident fibroblasts are derived from the epicardium, and cells derived from the epicardium and resident fibroblasts express col1a2:mCherry after injury. (A) Experimental scheme for tracing the fate of wt1a-derived cells. 4-OHT was administered from 48 to 72 h postfertilization (hpf). (B–E) Immunofluorescence of 5 d postfertilization (dpf) embryos with anti-GFP (green) and mCherry (red). Nuclei are counterstained with DAPI. (C–E) Single channels of the merged image shown in B. (F–I) Immunofluorescence of whole-mount adult hearts with anti-GFP (green) and mCherry (red). Nuclei are counterstained with DAPI. Orthogonal views of the plane highlighted with dotted lines are shown below. Shown are single (G–I) and merged (F) channels. (J) Experimental scheme for tracing the fate of tcf21-derived cells expressing col1a2. The tcf21:CreERT2 line was crossed with the col1a2:loxP-tagBFP-STOP-loxP-mCherry-NTR line. Upon 4-OHT administration, recombination of loxP sites leads to activation of mCherry expression under the control of a col1a2 promoter. Hearts from animals at 7 dpi were dissected and sectioned. (K–N) Immunofluorescence of the heart sections with anti-MHC (green) and mCherry (red). Nuclei are counterstained with DAPI. Asterisk indicates injured area. (Mand N) Merged and individual channels of the boxed area in K. Arrowheads mark mCherry+ cells, which express col1a2. at, atrium. [Scale bars, 25 μm (B, F, and M) and 100 μm (K).] |

Kidney marrow-derived cells do not contribute to collagen deposition during fibrotic response to cryoinjury. (A) Kidney marrow-derived cells from a transgenic line ubiquitously expressing GFP and mCherry under the control of col1a2 regulatory regions were transplanted into irradiated wild-type adult zebrafish. After kidney marrow reconstitution, host hearts were cryoinjured. Expression of mCherry and GFP was assessed at 7 dpi by immunofluorescence of sections. MHC marks the myocardium, and nuclei are counterstained with DAPI. (B) Whole-heart section of a transplanted heart at 7 dpi. (C–E) Merged and single channels of the boxed area in B. No mCherry signal is visible. (F) Control whole-heart section from a col1a2:mCherry transgenic fish at 7 dpi. (G–I) Merged and single channels of the boxed section shown in F; mCherry signal is detected in the epicardium and injury areas. Asterisks indicate the injury area. [Scale bars, 25 μm (C and G) and 100 μm (B and F).] |
Endocardial cells at the injury area express collagen 1a1 but not EMT markers. (A–I) Lineage tracing of endocardial cells in the uninjured and injured heart. (A) Experimental scheme for tracing the contribution of endocardial cells to fibrosis using the ubb:Switch reporter line. (B and F) Immunofluorescence staining of whole-heart sagittal sections (B, uninjured; F, 7 dpi) with anti-mCherry (red), anti-col1a1 (green), and anti-MHC (gray); nuclei were DAPIcounterstained (blue). C–E and G–I are merged and single channels of a zoomed-in view of the endocardial border in the apex or close to the injury area (IA; asterisk). fli1a-derived cells are mCherry+ (red). Note that at 7 dpi, mCherry+ cells (red) are closely associated with col1a1 (green) deposits (arrowheads). (J– L) Epithelial-to-mesenchymal transition (EMT) markers are expressed by wt1a:GFP+ cells but not by kdrl:mCherry+ cells. Graphs show the fragments per kilobase million (fpkm) values for the same genes and samples. Shown are individual measurements as well as mean and SD. EMT genes were more abundant in wt1a+ cells than in kdrl+ cells both before and after injury. [Scale bars, 25 μm (C and G) and 100 μm (B and F).] |

Colocalization of postnb:citrine+ and col1a2:mCherry+ cells. (A and B) FACS-sorted cells of 7 dpi hearts from co1a2:mCherry;postnb:citrine doubletransgenic fish. Based on these markers, three populations could be detected: double-positive, postnb+, and col1a2+. Shown are individual measurements as well as mean and SD. (C–G) Immunofluorescence with anti-GFP (green) and anti-mCherry (red) of a heart section from an adult postnb:citrine;col1a2:mCherry- NTR fish. Note the presence of double-positive (yellow arrowheads), col1a2+ (red arrowheads), and postnb+ cells (green arrowheads). (H–J) Heatmaps representing the expression levels of all of the secreted proteins that were identified to be up-regulated when comparing postnb:citrine+ cells at 7 dpi with the rest of the cells at the injury (with the exception of the kdrl:mCherry population). Fragments per kilobase million values were used. The list of genes encoding secreted molecules was obtained by using Ingenuity software and manually adding the genes encoding for collagens and metalloproteinases not identified by Ingenuity. For better visualization of changes in gene expression between the two groups, values were scaled independently for each gene, that is, each row. [Scale bars, 25 μm (C) and 100 μm (D and E).] |

Apoptotic and senescent fibroblasts during heart regeneration. (A and B) qPCR of col1a2 and postnb at different days postinjury. Symbols show data for individual samples; bars and whiskers show mean ± SD; ***P < 0.001, **P < 0.01 by one-way ANOVA followed by Tukey’s multiple comparisons test. ns, not significant. (C) postnb+ apoptotic (TUNEL+) cell quantification. (D–G) TUNEL staining of postnb:citrine heart sections. myo, myocardium. pstnb:citrine+ cells, yellow arrowheads; TUNEL+ cells, white arrowheads. (Scale bars, 25 μm.) |

Expression pattern of wt1a:GFP and postnb:citrine in fully regenerated hearts. (A–D) postnb mRNA in situ hybridization (purple) followed by anti-GFP immunohistochemistry (brown) of sections of wt1a:GFP ventricles at 130 dpi (n = 3/3). Arrowheads mark wt1a:GFP+ cells. Sections were stained simultaneously with those shown in Fig. 1 C–F. (E–H) Immunofluorescence with anti-GFP (green) and anti-MHC (red) of a postnb:citrine heart section at 130 dpi (n = 4/4). Nuclei are counterstained with DAPI. Arrowheads mark GFP+ cells. [Scale bars, 100 μm (A, B, and E) and 25 μm (C, D, and F).] |

Heart regeneration upon genetic ablation of col1a2-expressing cells. (A) col1a2:mCherry-NTR (in short col1a2:NTR) adult animals were cryoinjured and treated with Mtz from 4 to 6 dpi. BrdU injection was performed 1 d before fixation to assess cardiomyocyte proliferation. (B–E) Immunofluorescence of heart sections of col1a2:mCherry-NTR treated with Mtz (B and C) or untreated controls (D and E). mCherry, red; MHC, green; nuclei (DAPI), blue for B and D, and cyan for C and E. Asterisk, injured area. In Mtz-treated fish, col1a2:mCherry-NTR labels cells with fragmented nuclei and the homogeneous mCherry expression observed in the wild-type heart is lost. (F) Experimental scheme to study regeneration upon genetic ablation of col1a2-expressing cells. col1a2:NTR transgenic zebrafish were cryoinjured and treated with 10 mM Mtz between 4 to 6 and 11 to 12 dpi. Hearts were dissected at 35 dpi, sectioned, and stained with AFOG to determine the degree of regeneration. (G and H) AFOG-stained sagittal sections through ventricles of a Mtz-treated col1a2:loxP-tagBFP-loxPmCherry- NTR heart (control) and a Mtz-treated col1a2:NTR heart. (I) Quantification of the injury area versus total ventricular area from 28 control hearts and 12 col1a2:NTR hearts. Blue and red colors indicate results from two independent experiments. Shown are individual measurements as well as mean and SD. No significant difference was observed between control and col1a2:NTR groups by unpaired Student’s t test (P = 0.75). (J) Experimental scheme. col1a2:NTR transgenic zebrafish were cryoinjured and treated with 10 mM Mtz between 14 and 16 dpi. Hearts were dissected at 35 dpi, sectioned, and stained with AFOG to determine the degree of regeneration. (K and L) AFOG-stained sagittal sections through ventricles of a Mtz-treated col1a2:loxP-tagBFP-loxP-mCherry-NTR heart (control) and a Mtz-treated col1a2:NTR heart. (M) Quantification of the injury area versus total ventricular area from 10 control hearts and 11 col1a2:NTR hearts. Shown are individual measurements as well as mean and SD. No significant difference was observed between control and col1a2:NTR groups by unpaired Student’s t test (P = 0.2113). (Scale bars, 100 μm.) |

Colocalization of col1a2:mCherry and anti-col1a1 at different stages postinjury and ablation. Sagittal sections through col1a2:mCherry hearts at 4 dpi (A–E; n = 4/4), 7 dpi (F–J; n = 4/4), 7 dpi treated with Mtz (K–O; n = 4/4), 14 dpi (P–T; n = 4/4), and 35 dpi (U–Y; n = 3/3). Sections were immunostained with anti-mCherry (red), anti-col1a1 (green), and anti-MHC (white). Nuclei were counterstained with DAPI (blue). [Scale bars, 25 μm (B, G, L, Q, and V) and 100 μm (A, F, K, P, and U).] |