
- Title
-
An optimised pipeline for parallel image-based quantification of gene expression and genotyping after in situ hybridisation.
- Authors
- Dobrzycki, T., Krecsmarik, M., Bonkhofer, F., Patient, R., Monteiro, R.
- Source
- Full text @ Biol. Open

Overview of the method to extract DNA for genotyping zebrafish mutants after ISH and measure the mRNA levels. (A) Embryos collected from an incross of fish heterozygous for a mutant allele are probed for the measured gene with a standard ISH protocol. After imaging in 100% glycerol, genomic DNA is extracted using the HotSHOT protocol by adding the lysis buffer directly to the embryo in a 0.2 ml PCR tube, followed by a ≥5 min incubation at 95°C. This DNA is used for genotyping of the embryos by PCR and restriction fragment length polymorphism (RFLP). In parallel, the images for each embryo are inverted and converted to 8-bit greyscale. ROIs of identical shape and size containing the ISH signal (yellow) and background (green) are manually selected and measured. The measurements, assigned to corresponding genotypes, are statistically analysed. (B) DNA fragments amplified from single fixed and ISH-probed embryos after incubation in HotSHOT lysis buffer for 5, 15, 30, 45, 60 and 120 min followed by JumpStart™ REDTaq® ReadyMix™ PCR. Primer pairs designed for the gata2a, runx1, tgfbr2b and tgfb3 produced 600, 300, 176 and 144 bp fragments, respectively. Three wild-type embryos were used for each time point. First lane from the left: 100 bp DNA ladder. (C) DNA fragments amplified from single fixed and ISH-probed wild-type embryos after DNA extraction in HotSHOT lysis buffer for 5 min using a primer pair to amplify a 300 bp fragment of the runx1 locus with JumpStart™ REDTaq® ReadyMix™ PCR. First lane from the left: 100 bp DNA ladder. The lanes after the ladder represent embryos that are 14 h, 1, 2, 3 and 4 days old and have been stored in glycerol at room temperature for 2 years. |
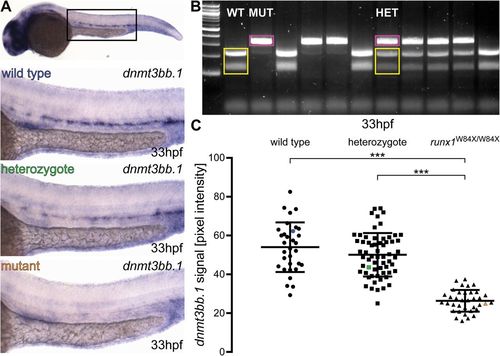
Runx1 mutants have significantly reduced levels of dnmt3bb.1 mRNA detected by ISH. (A) Representative images of ISH for dnmt3bb.1 in 33 hpf wild-type (blue), runx1+/W84X (green) and runx1W84X/W84X (orange) embryos, showing the expression in the dorsal aorta. The top panel indicates the location of the zoomed regions in a wild-type embryo. (B) 2% agarose gel showing representative genotypes of wild-type (WT), heterozygous (HET) and mutant (MUT) runx1 embryos, distinguished by RFLP. Yellow: wild-type 214 bp+124 bp bands, pink: 338 bp mutant band. First lane from the left: 100 bp DNA ladder. (C) Pixel intensity values of dnmt3bb.1 mRNA in runx1W84X/W84X embryos (n=36) are significantly decreased compared to wild type (n=32) and heterozygotes (n=62) (ANOVA, P<0.001). The coefficients of variation are 24%, 22% and 21% for wild-type, heterozygote and mutant groups, respectively. Blue, green and orange data point correspond to the example images from panel A. The bars represent mean±s.d. ***P<0.001 (Games-Howell post-hoc test). |

Gpr65 morphants have significantly increased levels of runx1 mRNA detected by ISH. (A) Representative images of ISH for runx1 in 29 hpf wild-type (blue) and gpr65 MO-injected (orange) embryos, showing the expression in the dorsal aorta. (B) Pixel intensity values of runx1 mRNA in in gpr65 MO-injected embryos (n=16) are significantly higher than in uninjected control siblings (n=16). The coefficients of variation are 34% and 26% for wild-type and morphant groups, respectively. Blue and orange data point correspond to the example images from panel A. The bars represent mean±s.d. *P<0.05 (t-test). The power of the t-test to detect the difference at 0.05 level was 63%. |

Runx1 levels detected by ISH are not affected in lmo4a mutants. (A) TALENs were designed to a region (blue) ∼20 bp downstream of the lmo4a translation start site (green). Isolated mutant alleles carry 5 bp deletions (Δ25-29) (red gaps) upstream of the conserved LIM domains (orange), resulting in a frameshift after S8. The resulting mutant protein is predicted to lack the LIM domains, including the crucial S39 (dark red). (B) Representative images of ISH for runx1 in 28 hpf wild-type (blue), heterozygous (green) and lmo4aΔ25-29/Δ25-29 (orange) embryos, showing the expression in the dorsal aorta. (C) 2% agarose gel showing representative genotypes of wild-type (WT), heterozygous (HET) and mutant (MUT) lmo4a embryos, distinguished by RFLP. Yellow: wild-type 258 bp+87 bp bands, pink: 340 bp mutant band. First lane from the left: 100 bp DNA ladder. (D) Quantification of the runx1 mRNA signal, detected by ISH, from 28 hpf wild-type (n=15), heterozygous lmo4a+/− (het) (n=34) and lmo4aΔ25-29/Δ25-29 mutant (n=18) embryos from one clutch shows no significant difference in runx1 pixel intensity among the different genotypes (ANOVA, P>0.6). The coefficients of variation are 41%, 38% and 37% for wild-type, heterozygote and mutant groups, respectively. Blue, green and orange data point correspond to the example images from panel B. The bars represent mean±s.d. (E) Boxplots displaying normalised runx1 mRNA levels (2−ΔCt) in single wild-type (blue; n=12) and lmo4aΔ25-29/Δ25-29 (mut, orange; n=12) embryos, measured by qRT-PCR, showing decreased levels of runx1 in the mutants compared to wild type. *P<0.05 (t-test). |

Phenotypic scoring of dnmt3bb.1-probed embryos does not fully correspond to their runx1 genotype. A) The phenotypes of 130 33hpf dnmt3bb.1-probed embryos coming from the incross of runx1 heterozygotes scored as ‘high’ (N=34), ‘medium’ (N=64) and ‘low’ (N=32) follow a Mendelian distribution. B) Distribution of the phenotypes according to the genotype. Images show a representative phenotype scored as ‘high’, ‘medium’ or ‘low’. Percentages show the occurrence of the phenotypes for the given genotype. |