
- Title
-
Separate roles for Med12 and Wnt signaling in regulation of oxytocin expression
- Authors
- Spikol, E.D., Glasgow, E.
- Source
- Full text @ Biol. Open

Expression of oxt in the pre-optic area is undetectable in the med12 mutant while expression of transcription factors required for oxt remain intact. (A) A simplified diagram of the transcriptional network regulating oxytocin expression. Otpb, Sim1a, Pou3f2b, Fezl, and Lhx5 are all required for oxytocin expression. B-C′ are all dorsal views of oxt expression in the PO of WISH embryos magnified ×100. (B,B′) 72 hpf. (C,C′) 96 hpf. B,C are wild-type siblings. B′,C′ are med12 mutants. D-K′ are all lateral views of 48 hpf WISH embryos magnified ×100. D,E,F,G,H,I,J,K are wild-type siblings. D′,E′,F′,G′,H′,I′,J′ are med12 mutants. (D,D′) oxt expression in the PO. (E,E′) pou3f2b expression in the PO (F,F′) pou3f2a expression in the PO. (G,G′) sim1a expression in the vTha, PT, and PO. (H,H′) otpb expression in the H, PT, and PO. (I,I′) fezl expression in the PO and Tel. (J,J′) lhx5 expression in the PO, Tel and H. (K,K′) mytl1a expression in the POA. PO, pre-optic area; TeO, optic tectum; vTha, ventral thalamus; PT, posterior tuberculum; H, hypothalamus; Ce, cerebellum; MO, medulla oblongata; Tel, telencephalon. |
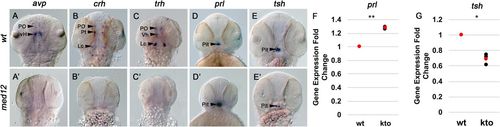
Med12 is required for expression of avp, crh and trh and modulates expression of prl and tsh. A-E′ are all dorsal views of WISH in 48 hpf embryos magnified ×100. (A,B,C,D,E) wild-type siblings. (A′,B′,C′,D′,E′) med12 mutants. (A,A′) avp expression in the PO and vH. (B,B′) crh expression in the PO, PT and Lc. (C,C′) trh expression in the PO, vH and Lc. (D,D′) prl expression in the pituitary. (E,E′) tsh expression in the pituitary. (F,G) Expression of prl (F) and tsh (G) were measured in 48 hpf embryos using RT-qPCR. Gene expression values were normalized to an endogenous control, beta actin 2 (actb2), and are expressed as fold changes relative to wild-type sibling controls. **P<0.01, *P<0.05, two-tailed paired Student's t-test. Dot plots show three biological replicates (black) and the mean (red). PO, pre-optic area; PT, posterior tuberculum; Lc, locus coerulus; vH, ventral hypothalamus; Pit, pituitary. |

Med12 is epistatic to Apc and is required for Wnt-dependent gene expression. A-D are all lateral views of 48 hpf embryos. (A,A′) wild-type embryos. (B) apchu745/hu745 mutant. (C,C′) med12y82/y82 mutants. (D,D′) apc hu745/hu745; med12y82/y82 double mutant. In A′,C′ and D′, the black dotted line represents the distance from the yolk to the tail tip and the red dotted line represents the tail length. (E) Tail curvature of apc hu745/hu745; med12y82/y82 double mutants was compared to that of wild-type and med12y82/y82 mutant embryos. Tail curvature is the tail length divided by the distance from yolk to tail tip. wild type: n=20, med12y82/y82: n=24, apc hu745/hu745; med12y82/y82: n=8. A, P<0.001; B, P<0.05, two-tailed unpaired Student's t-test. Error bars show s.e.m. (F) The number of melanophores on the lateral surface of the yolk of apc hu745/hu745; med12y82/y82 double mutants was compared to that of wild-type and med12y82/y82 mutant embryos. wild type: n=15, med12y82/y82: n=27, apc hu745/hu745; med12y82/y82: n=9. A,B P<0.001, two-tailed unpaired Student's t-test. Error bars show s.e.m. (G,G′) Representative images of GFP expression visualized at ×100 magnification in 24 hpf wild-type siblings and med12 mutants that are heterozygous for the TOP:GFP transgene. Arrows indicate area of reduced GFP expression. (H) Corrected head fluorescence was compared between wild-type and med12y82/y82 mutant embryos. Corrected head fluorescence is head fluorescence (Integrated Density) divided by the area of the head. wild type: n=8, med12y82/y82: n=9. P<0.001, two-tailed unpaired Student's t-test. Error bars show s.e.m. (I,I′) Representative full embryo views of GFP expression magnified ×50 in 24 hpf wild-type siblings and med12 mutants that are heterozygous for the TOP:GFP transgene. Dashed line indicates an example of the area (the head) that was circled for fluorescence and area measurements in H. J,J′ are dorsal views of WISH for lef1 in 48 hpf embryos magnified ×100. (J) wild-type sibling. (J′) med12 mutant. |

Expression of oxt is undetectable in the med12 mutant but is unaffected by treatment with Wnt inhibitors. A-C are all dorsal views of WISH for oxt in 48 hpf embryos magnified ×100 in which arrowheads indicate oxt expression. Embryos treated with IWR and med12 mutants were compared to sibling controls. (A) wild-type embryo. (B) med12 mutant embryo. (C) IWR-treated embryo. (D) oxt expression was measured using RT-qPCR in 48 hpf embryos. Gene expression values were normalized to an endogenous control, beta actin 2 (actb2), and are expressed as fold changes relative to wild-type sibling, or vehicle-treated wild-type sibling controls. A: P<0.01, two-tailed paired Student's t-test. Dot plot shows three biological replicates (black) and the mean (red). (E,E′,F,F′) Representative images of GFP expression was visualized in 24 hpf vehicle and IWR-treated embryos that are heterozygous for the TOP:GFP transgene. (E,E′) Magnified ×100. Arrows indicate area of reduced GFP expression. (F,F′) Representative full embryo views magnified ×50. |

Expression of oxt is reduced in the apc mutant and LiCl-treated embryos starting at 24 hpf. A-B′ are all dorsal views of WISH for oxt magnified ×100. (A,A′) 48 hpf embryos. (B,B′) 72 hpf embryos. (A,B) wild-type siblings. (A′,B′) apc mutants in which arrows indicate areas of reduced oxt expression. (C,C′) oxt expression was measured at 48 and 72 hpf in wild-type and apc mutant embryos using RT-qPCR. Gene expression values were normalized to an endogenous control, beta actin 2 (actb2), and are expressed as fold changes relative to wild-type sibling controls. **P<0.01, two-tailed paired Student's t-test. Dot plots show three biological replicates (black) and the mean (red). (D) Timeline schematic showing LiCl treatment time and duration. Lettering in the schematic corresponds to labeling in the figure. Triangle represents fixation point for treatments E,F,G,H,I,K and L. Circle represents fixation point for treatment J. Red, no effect on oxt expression. Green, leads to reduced oxt expression. E,E′,E″,E′″ are all dorsal views of WISH for oxt magnified ×100. E-K′ are all dorsal views of WISH for oxt in wild-type embryos magnified ×100. E,F,G,H,I,J,K underwent sham treatment in fish water. E′,E″,E″′,F′,G′,H′,I′,J′,K′ were treated with LiCl. Arrows in F′,G′,H′,I′,J′,K′ indicate areas of reduced oxt expression. (E-K′) 48 hpf. (J,J′) 57 hpf. (E-E′″) treated at 5 hpf for 20 min. (F,F′) treated at 8 hpf for 30 min. (G,G′) treated at 20 hpf for 1 h. (H,H′) treated at 24 hpf for 1 h. (I,I′) treated at 30 hpf for 1 h. (J,J′) treated at 31 hpf for 4.5 h. (K,K′) treated at 41 hpf for 5 h (L) oxt expression was measured in LiCl and sham treated embryos at 48 hpf using RT-qPCR. 1: treated at 10 hpf for 1 h; 2: treated at 18 hpf for 3 h; 3: treated at 28 hpf for 3.75 h. 4: treated at 36 hpf for 12 h. Gene expression values were normalized to an endogenous control, beta actin 2 (actb2), and are expressed as fold changes relative to sham-treated wild-type sibling controls. **P<0.01, two-tailed paired Student's t-test. Dot plot shows three biological replicates (black) and the mean (red). EXPRESSION / LABELING:
PHENOTYPE:
|
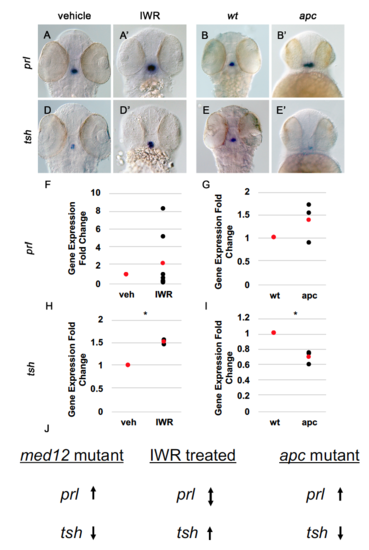
Alterations in Wnt signaling modulate prl and tsh gene expression in the pituitary. (A, A’, B, B’, D, D’, E, E’) are all dorsal views of WISH in 48 hpf embryos magnified x100. (A, D) wt siblings, vehicle treated. (A’, D’) wt, IWR-treated embryos. (B, E) wt siblings. (B’, E’) apc mutant embryos. (A, A’, B, B’) prl expression in the pituitary. (D, D’, E, E’) tsh expression in the pituitary. Expression of prl (F, H) and tsh (G, I) were measured in IWR-treated (F, H) and apc mutant (G, I) 48 hpf embryos using RT-qPCR. Gene expression values were normalized to an endogenous control, beta actin 2 (actb2), and are expressed as fold changes relative to wt sibling, or vehicle-treated wt sibling controls. Dot plots show three biological replicates (black) and the mean (red). (J) Schematic comparing prl and tsh gene expression changes in med12 mutant embryos, IWR-treated embryos, and apc mutant embryos. |

Pou3f2b, sim1a, and otp are expressed in the pre-optic area of the apc mutant. (A, A’, B, B’, C, C’) are all lateral views of WISH in 48 hpf embryos magnified x100 in which arrowheads indicate the PO. (A, B, C) wild type siblings. (A’. B’, C’) apc mutant embryos. (A, A’) pou3f2 expression in the PO. (B, B’) sim1a expression in the PO, PT and vTha. (C, C’) otp expression in the PO, PT, and H. PO, pre-optic area; vTha, ventral thalamus; PT, posterior tuberculum; H, hypothalamus; TeO, optic tectum; Ce, cerebellum; MO, medulla oblongata. |

Unillustrated author statements |