
- Title
-
Cystathionine β-Synthase Is Necessary for Axis Development in Vivo.
- Authors
- Prabhudesai, S., Koceja, C., Dey, A., Eisa-Beygi, S., Leigh, N.R., Bhattacharya, R., Mukherjee, P., Ramchandran, R.
- Source
- Full text @ Front Cell Dev Biol
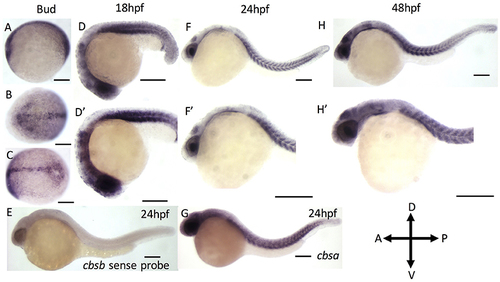
ISH analysis of cbsa and cbsb genes in zebrafish embryos. (A–G) are digioxigenin-labeled whole mount in situ hybridization for cbsa and cbsb RNA. Panels (A–C) are bud stage, (D,F,H) are 18, 24, and 48 hpf embryos respectively, Panels (D–H′) are high power images of the respective (D,F,H). Panel (E) is a cbsb sense probed 24 hpf embryo, and Panel (G) is a cbsa antisense probed embryo at 24 hpf. Scale bars indicate 0.25 mm. |
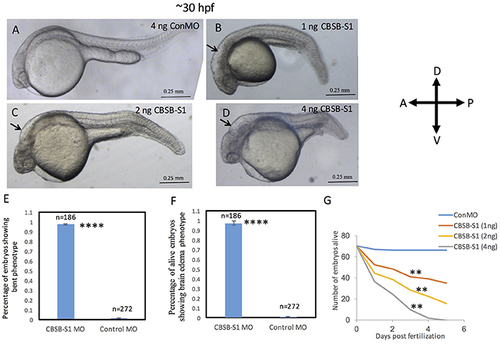
Dose-dependent effect of cbsb morpholinos at 30 hpf. Phase contrast images of 30 hpf embryos injected with 4 ng of control (Con) MO (A); 1 ng cbsb splice1 (CBSB-S1) MO (B); 2 ng (CBSB-S1) (C) and 4 ng (CBSB-S1) (D) are shown. Arrow shows brain edema. Panels (E,F) quantifies the number of CBSA-S1 MO-injected embryos displaying bent axis, and brain edema (black arrows) compared to ConMO-injected embryos. n = 186 surviving embryos for CBSB-S1 MO and n = 272 surviving embryos for ConMO, which were a total of four experiments ****P < 0.0001 for both bent axis phenotype and brain edema phenotype. (G) Percentage survival observed over a 5 day period for three different doses of CBSB-S1-injected (1 ng, n = 70; 2 ng, n = 70; 4 ng, n = 70) and ConMO-injected embryos (4 ng, n = 70), n = 6 time points, **P < 0.01 for comparison between ConMO and each of the respective CBSB-S1 MO doses. Scale bars indicate 0.25 mm. |
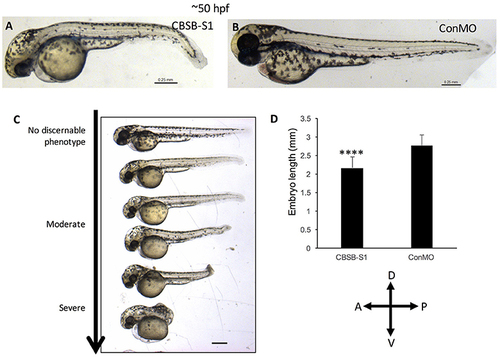
cbsb morphant phenotype at 52 hpf. Low magnification images of 52 hpf Tg (flk:EGFP) embryos injected with 2 ng CBSB-S1 (A) and 2 ng control (Con) MO are shown. Panel (C) shows various phenotypes observed from mild to server for CBSB-S1 at 52 hpf. Note the progressive loss of axis length. Panel (D) shows quantification of the length of the axis is shown in (A). Y-axis shows mean length of the embryo measured as the longest horizontal dimension between the start of the yolk and the end of the tail (n = 11 for CBSB-S1 and ConMO-injected embryos), ****P < 0.0001. In the figure panels, the embryo orientation is left is anterior (A) and right is posterior (P) while top is dorsal (D) and bottom is ventral (V). Scale bars indicate 0.25 mm. PHENOTYPE:
|
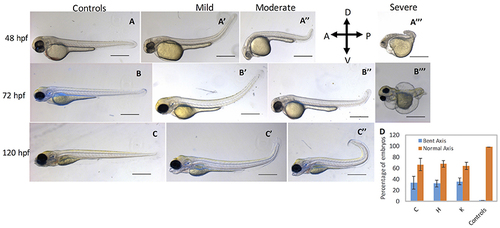
cbsb CRISPR embryos show axis defects. Control flk:EGFP CASPER embryos are shown at 48 hpf (A), 72 (B), and 120 hpf (C). cbsb CRISPR embryos are shown at 48 hpf (A′-A‴ ), 72 hpf (B′-B‴ ), and 120 hpf (C′,C″). Mild, medium, and severe phenotypes are shown for each time point for the cbsb CRISPR embryos except at 120 hpf. Panel (D) shows quantification of the axis defects in three independent CRISPR lines (C, H, and K) and comparison of the axis defects with control flk:EGFP CASPER line. Y axis shows the average of the percentage of embryos from five experiments with bent axis and normal axis. n = 311 embryos for C line, n = 236 embryos for H line, n = 241 embryos for K line and n = 311 embryos for the control flk:EGFP CASPER line which are total number of embryos from five independent experiments. To perform statistical analysis, embryos showing any degree of bent axis phenotype (mild, medium, or severe) have been grouped together into one category called bent axis. *P < 0.05 for comparison of percent embryos with bent axis between controls and CRISPR line C, ***P < 0.001 for comparison of percent embryos with bent axis between controls and CRISPR line H and ***P < 0.001 for comparison of percent embryos with bent axis between controls and CRISPR line K. In the figure panels, the embryo orientation is left is anterior (A) and right is posterior (P) while top is dorsal (D) and bottom is ventral (V). Scale bars in the 48 and 72 hpf panels indicate 0.25 mm; scale bars in 120 hpf panels (C–C″) are 0.4 mm. Error bars indicate standard error of the mean of five experiments. PHENOTYPE:
|
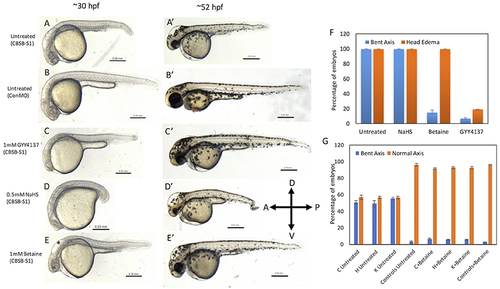
Rescue of cbsb phenotypes using small molecules at 30 and 52 hpf. All embryos were injected to 2 ng of cbsb-splice1 (CBSB-S1) or control (Con) morpholinos (MOs). Panels (A–E) are 30 hpf phase contrast images, and corresponding (A′-E′) are 52 hpf images. Panels (A,A′) is an untreated embryo injected with CBSB-S1 MO, which shows distinct phenotypes including head edema, and axis defect. Panels (B,B′) are ConMO-injected embryo. Panels (C,C′) are CBSB-S1-injected embryo treated with 1 mM GYY4137, which rescues the head edema and axis defects. Panels (D,D′) are CBSB-S1-injected embryo treated with 0.5 mM NaHS, which does not rescue the phenotype. Panels (E,E′) are CBSB-S1 injected embryo treated with 1 mM betaine, which rescues the axis defect but not the head edema (black asterisk). Panel (F) shows quantification of the rescue of bent axis and head edema phenotypes for CBSB-S1 MO-injected embryos. Y axis shows percentage of embryos with bent axis phenotypes and head edema phenotypes (average of three experiments). Three experiments were performed. X axis categories: Untreated n = 118 embryos, NaHS treated n = 111 embryos, Betaine treated n = 120 embryos and GYY4137 treated n = 121 embryos which are total number of embryos for 3 experiments. ***P < 0.0001 for comparison between untreated and betaine treated for bent axis phenotypes. ***P < 0.0001 for comparison between untreated and GYY4137 treated for both bent axis and head edema phenotypes. Error bars indicate standard error of the mean of three experiments. Panel (G) shows quantification of cbsb CRISPR lines (C, H, and K) for the betaine rescue of axis defects at 5 dpf. For statistical analysis, all embryos with bent axis (irrespective of severity: mild, medium, and severe) were placed into one category bent axis. Y axis shows average of percentage of embryos (with bent axis or normal axis) from three experiments. n = 114 For C Untreated, n = 120 for H Untreated, n = 112 for K Untreated, n = 121 for Controls Untreated, n = 120 for C + Betaine, n = 119 for H + Betaine, n = 124 for K + Betaine and n = 117 for Controls + Betaine, which are total number of embryos from 3 independent experiments. T-test analysis resulted in **P < 0.001 for comparisons between untreated cbsb CRISPR lines and cbsb CRISPR lines treated with betaine. (C vs. C + Betaine, H vs. H + Betaine, K vs. K + Betaine). Differences between control and control + Betaine groups were not statistically significant. Error bars indicate standard error of the mean of three experiments. |

ZFIN is incorporating published figure images and captions as part of an ongoing project. Figures from some publications have not yet been curated, or are not available for display because of copyright restrictions. EXPRESSION / LABELING:
|

Quantification of the cbsb morphant phenotype studies. Each panel shows the number of embryos that indicate the phenotype. |
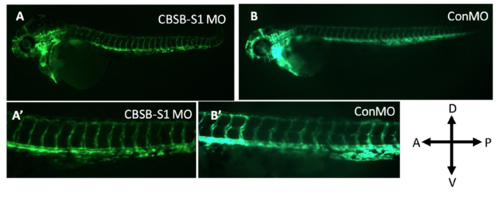
Lack of vascular phenotype in cbsb (~50 hpf) morphants. The Tg (flk:EGFP) fish used in the figure 5 experiment carried a VEGFR2 promoter (FLK) driving enhanced green fluorescent protein (EGFP) in the vasculature. A and A’ are cbsb splice MO1 (CBSB-S1) MOinjected fish while B and B’ are control (Con) MO-injected fish. A’ and B’ are high magnification images of the trunk vasculature. In the figure panels, the embryo orientation is left is anterior (A) and right is posterior (P) while top is dorsal (D) and bottom is ventral (V). |
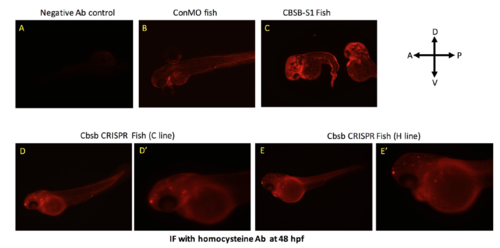
Homocysteine IF in cbsb morphant and CRISPR fish. IF with homocyteine antibody was performed in 48 hpf control MO (ConMO) fish (A) and cbsb splice1 MO (CBSB-S1) injected (C) fish. Panel A shows fish with no primary antibody control. D and E are cbsb CRISPR 48 hpf fish from C and H line respectively. D’ and E’ are high power images of the head and yolk region. Note the halo staining around the yolk, which is indicative of homocysteine proteins in yolk as previously reported (Matthews et al., 2009). PHENOTYPE:
|