
- Title
-
Increased mechanical loading through controlled swimming exercise induces bone formation and mineralization in adult zebrafish
- Authors
- Suniaga, S., Rolvien, T., Vom Scheidt, A., Fiedler, I.A.K., Bale, H.A., Huysseune, A., Witten, P.E., Amling, M., Busse, B.
- Source
- Full text @ Sci. Rep.

Setup for the experimental musculoskeletal loading of adult zebrafish. (a) Swim tunnel used for conducting the exercise experiment. Zebrafish belonging to the exercise group were placed inside the blue chamber during exercise units; white arrows indicate the direction of the water current. Magnified image on the right displays the exercise group during an exercise session. (b) Zebrafish belonging to the exercise group were trained for four weeks at step-wise increasing hours per day (4 h/day in week one, 5 h/day in week two and three, 6 h/day in week four) while control zebrafish did not experience any exercise. Both groups were labeled using fluorescent chromophore calcein submersions before and after the experiment. (c) Schematic depiction of a zebrafish vertebra. Lateral view (left) and transverse cross section (right). |

Changes to the body size of the zebrafish. (a) Two representative images of a zebrafish from the control group and the exercise group. (b) Zebrafish standard length and (c) body weight measurements performed after the exercise experiment yielded no significant difference between the groups. |

Bone microstructural changes due to musculoskeletal exercise. (a) Contact X-ray image displays the volume of interest (VOI) in the caudal spine of zebrafish. All parameters were extracted from caudal vertebrae. (b) Micro-CT images display the typical hourglass shape of the autocentrum that represents the core of the zebrafish vertebral body. The volume parameters extracted to quantify skeletal changes due to the swimming exercise are displayed on the sagittal cross-sections of the vertebrae: tissue volume (TV), bone volume (BV), and vertebral length (VL). The neural arch (NA) and the hemal arch (HA) were not included in the quantification of structural parameters via micro-CT. (c) Tissue volume was significantly higher in the exercise group. (d) Bone volume of the vertebral body was significantly greater in the exercise group. (e) Vertebral length increased substantially in the exercise group. The larger bone anatomy of the vertebral bodies of the zebrafish exposed to exercise indicates an increase in bone mass due to increased swimming activity. |

Characterization of bone formation by dynamic histomorphometry. (a) Micro-CT images of caudal vertebral bodies display the regions of interest (ROI) including the vertebral body end plates. (b) Fluorescence microscopy reveals fluorescent labeling in the end plates from both zebrafish groups. Larger inter-label distance can be observed in exercised zebrafish indicating higher bone formation activity. (c) Mineralized surface per bone surface (MS/BS) was significantly higher in the exercise group. (d) Mineral apposition rate (MAR) did not vary significantly between groups. (e) Bone formation rate (BFR) was significantly higher in exercised zebrafish. The increased deposition of new bone in the end plates of exercised zebrafish explains the increased vertebral length, bone volume and tissue volume measured using micro-CT (see Fig. 3). |

Bone formation mechanism. Static histomorphometric analysis of the bone formation mechanism in zebrafish. (a) Masson-Goldner trichrome-stained sections show the end plates of two adjacent vertebrae. Numerous osteoblasts (black arrows) can be observed in the same regions where fluorescence microscopy revealed increased bone formation. (b) Quantification of osteoblasts performed on Masson-Goldner trichrome-stained sections yielded higher osteoblast numbers and (c) greater osteoblast surface per bone surface in zebrafish from the exercise group. These results are consistent with higher bone deposition rates and higher bone volume found in the exercise group, given that pronounced osteoblast activity is associated with the deposition of new bone material. (d) Von Kossa/van Gieson stained sections display non-mineralized bone matrix, i.e. osteoid (black arrows), predominantly on the vertebral edges. (e) Osteoid surface per bone surface (OS/BS) remained similar between the groups. (f) Osteoid thickness (O.Th) was significantly lower in the exercise group compared to controls. |

Osteocyte characteristics in terms of osteocyte size, shape and orientation in zebrafish vertebrae. (a) Osteocyte lacunae appear ellipsoidal and their distribution and orientation change in relation to the anatomical site. Towards the end regions of the vertebrae, the longitudinal axis of the osteocyte orientation is tangential to the circumference and perpendicular to the long axis of the vertebra. Osteocyte lacunar orientation in the central region of the vertebrae was aligned (parallel) to the long axis of the vertebral body. (b) Mean lacunar sphericity and (c) mean osteocyte lacunar volume were not significantly different between groups. |

Bone mineral density distribution in zebrafish bone. (a) Quantitative backscattered electron microscopy images (pseudo-colored) of zebrafish vertebrae from the control group (left) and the exercise group (center) indicate a higher degree of bone mineralization in exercised zebrafish. Histograms depicting the bone mineral density distribution in calcium weight percentages (right) yielded substantial differences between the groups. (b) Exercised zebrafish displayed higher mean calcium content (CaMean) than zebrafish from the control group. (c) The amount of bone with a calcium concentration below the 5% threshold (CaLow) remained unchanged between the groups. (d) The amount of bone mineralized above the 95% threshold (CaHigh) was significantly higher in the exercise group thus indicating an enhancement of bone mineralization in the exercise group. |
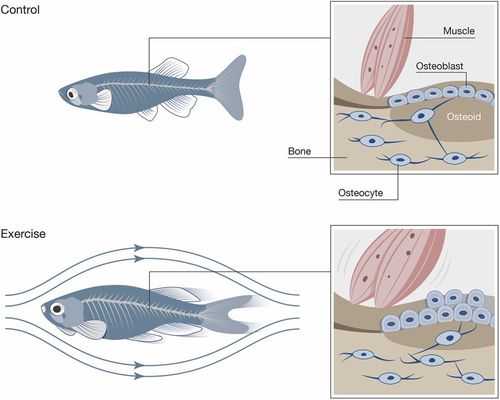
Effects of exercise on bone quality in zebrafish. Schematic depiction of the sum of effects induced by musculoskeletal loading of zebrafish following the swim tunnel experiment. Zebrafish from the exercise group (bottom) were subjected to higher muscular forces that translated into a higher load on zebrafish bone. Higher forces acted as a stimulant for osteoblast activity, which led to an increase of bone formation and mineralization. As a result, exercised zebrafish displayed higher bone mass with a higher degree of bone mineralization when compared to the control group. In humans, increased physical activity45,16. The results obtained from zebrafish exercise experiments provide therefore deeper insight into the complex mechanisms governing mechanical sensitivity of bone and the pathways that control bone formation and mineralization, thus affecting bone quality. |