
- Title
-
Lpar2b Controls Lateral Line Tissue Size by Regulating Yap1 Activity in Zebrafish
- Authors
- Wang, X., Hou, H., Song, K., Zhang, Z., Zhang, S., Cao, Y., Chen, L., Sang, Q., Lin, F., Xu, H.
- Source
- Full text @ Front. Mol. Neurosci.
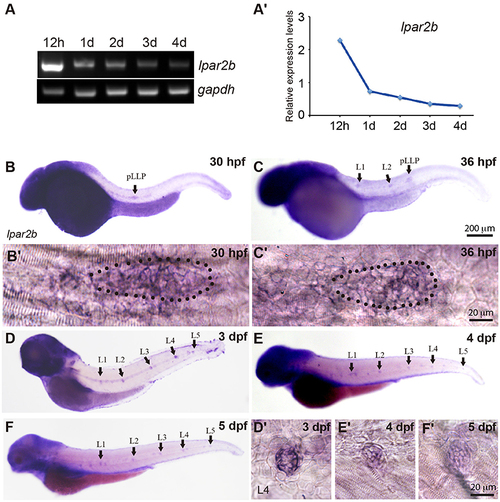
Lpar2b is expressed in the posterior lateral line in zebrafish. (A) RT-PCR shows the expression level of lpar2b in whole embryos from 12 hpf to 4 dpf. A house-keeping gene gapdh is used as control. (A′) Quantification of (A). (B–F) Whole-mount ISH detects the transcripts of lpar2b in embryos from 30 to 5 dpf. (B′,C′) High-magnification images of the pLLP in (B,C). The primordium is outlined by dots. (D′-F′) High-magnification images of the L4 NMs in (D–F). Arrows, pLLP or NMs as indicated in the pictures. hpf, hours post fertilization; dpf, day post fertilization. EXPRESSION / LABELING:
|
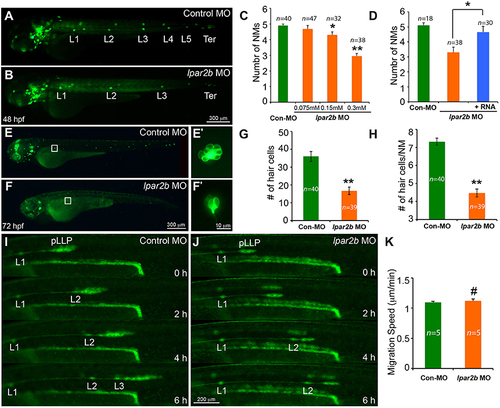
MO-mediated Lpar2b knock-down reduced the number of NMs and hair cells in the posterior lateral line. (A,B) Epifluorescence images of 48 hpf Et(gata2:EGFP)mp189b embryos injected with control or lpar2b MO. (C) Quantification of the number of trunk NMs (exclude terminal NMs) in one side of the pLL in (A,B). (D) Co-injection of MO-insensitive Lpar2b mRNA rescued the NMs phenotype caused by Lpar2b depletion. (E,F) Epifluorescence images of 72 hpf Tg(Brn3c:mGFP) embryos injected with control or lpar2b MO. (E′,F′) High-magnification images of hair cells in the L1 NMs in (E,F). (G) Quantification of the total number of hair cells in one side of the pLL (L1-L5) at 72 hpf. (H) Average number of hair cells per NM (L1-L5) at 72 hpf. (I,J) Snapshots from 6-h epifluorescence time-lapses movies of control or lpar2b MO-injected Tg(-8.0cldnb:lynEGFP) embryos at 30–36 hpf (Supplementary Movies 1, 2). (K) Quantification of the migration speed of the pLLP of (I,J). *p < 0.05; **p < 0.01; #p > 0.05 compared to control. EXPRESSION / LABELING:
PHENOTYPE:
|

Lpar2b regulates the patterning of the pLLP. (A) Confocal images showing the rosette structures in the pLLP of Tg(-8.0cldnb:lynEGFP) embryos at 32 hpf. (B) Immunostaining of ZO1 (red) in the pLLP of Tg(-8.0cldnb:lynEGFP) embryos at 32 hpf. Arrowheads mark the center of rosettes in (A,B). (C) Whole-mount ISH shows the expression of genes as indicated in the pLLP at 30–32 hpf in embryos injected with control or lpar2b MO. (D) Whole-mount ISH detects the expression of pea3 in the pLLP and midbrain-hindbrain boundary (MHB) regions in wild-type (WT) and Tg(hsp70:caFGFR1) embryos at 32 hpf. The Tg(hsp70:caFGFR1) embryos were heat shocked at 24 hpf for 1 h at 37°C. The pLLP is outlined by dots in (C,D). (E) Epifluorescence images showing Tg(-8.0cldnb:lynEGFP) /Tg(hsp70:caFGFR1) double transgenic embryos injected with lpar2b MO. Upper panel, without heat shock; lower panel, with heat shock. Arrowheads, a trail of cells left by pLLP. (F,G) Quantification of the area expressing pea3 (F) or lef1 (G) in the pLLP. **p < 0.01; #p > 0.05 compared to control. |
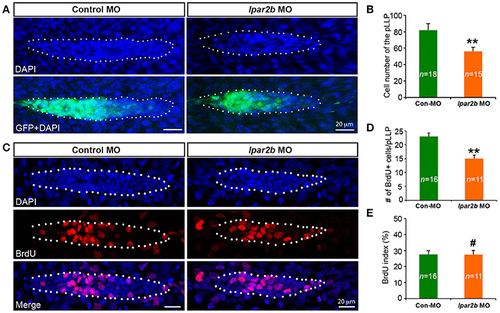
Lpar2b regulates the tissue size of the pLLP. (A) Confocal images showing the pLLP of control- or lpar2b MO-injected Et(gata2:EGFP)mp189b embryos at 32 hpf. The embryos were stained with DAPI to show cell nuclei (blue). GFP comes from the gata2:EGFP transgene. The pLLP is outlined by dots. (B) Quantification of the total number of cells in the pLLP. (C) Confocal images of the pLLP at 32 hpf after DAPI (blue) and BrdU (red) staining. (D) Quantification of the number of BrdU+ cells in the pLLP. (E) The BrdU index is calculated as (number of BrdU+ cells in pLLP)/(total number of pLLP cells). Con-MO, Control MO; **p < 0.01; #p > 0.05 compared to control. |
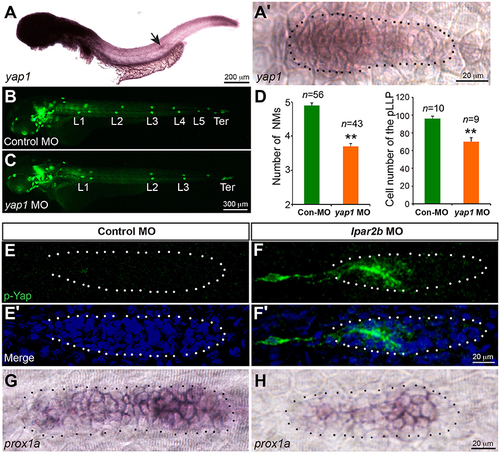
Lpar2b regulates Yap1 activity. (A,A′) Whole-mount ISH detects the mRNA of yap1 in embryos at 34 hpf. (A′) High-magnification of the pLLP in (A). (B,C) Epifluorescence images of control- or yap1 MO-injected Et(gata2:EGFP)mp189b embryos at 48 hpf. (D) Quantification of the NM number at 48 hpf and number of pLLP cells at 32 hpf in control- or yap1 MO-injected embryos. (E–F′) Confocal images of the pLLP stained with DAPI (blue) and p-Yap1 (green) at 32 hpf. (G,H) ISH shows a decreased prox1a expression in the pLLP of Lpar2b morphants. The pLLP is outlined by dots. **p < 0.01 compared to control. |
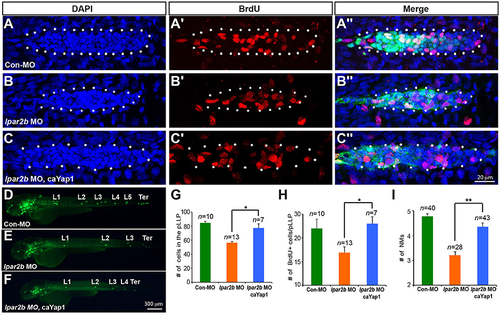
A phosphorylation-resistant Yap1 mRNA (caYap1) rescued the pLLP and NM phenotype of Lpar2b morphants. (A–C″) Confocal images of the pLLP stained with DAPI (blue) and BrdU (red) at 32 hpf in Et(gata2:EGFP)mp189b embryos injected with control MO (A–A″), lpar2b MO (B–B″) or lpar2b MO and caYap1 mRNA together (C–C″). The pLLP is outlined by dots. (D–F) Epifluorescence image s of Et(gata2:EGFP)mp189b embryos injected with control MO (D), lpar2b MO (E), or lpar2b MO and caYap1 mRNA together (F) at 48 hpf. (G–I) Quantification of the total number of cells (G) and the number of BrdU+ cells (H) in the pLLP at 32 hpf, and the number of NMs at 48 hpf (I) in 3 groups of embryos as indicated. *p < 0.05; **p < 0.01. |
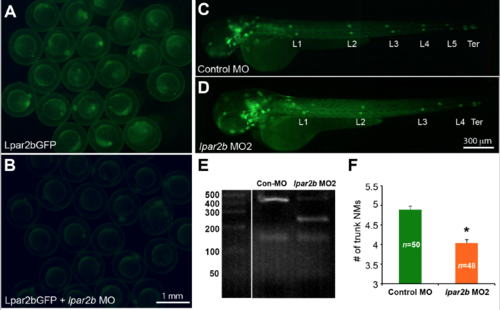
Validation of the efficacy of the MOs used in the study. (A-‐B) Fluorescence images showing 8-‐hpf embryos injected with the Lpar2bGFP construct (A) alone, or together with lpar2b MO (B). (C,D) Epifluorescence images of control MO-‐ or lpar2b MO2-‐injected Et(gata2:EGFP)mp189b embryos at 48 hpf. (E) The splicing-‐blocking lpar2b MO2 disrupts normal slicing of the lpar2b pre-‐mRNA as shown by RT-‐PCR. (F) Quantification of the number of NMs at 48 hpf in (C,D). *, p < 0.05 compared to control. |
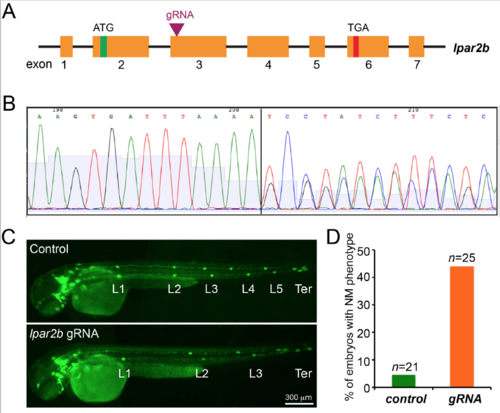
Genetic mutation of lpar2b generated by the CRISPR-‐Cas9 system produces a similar NM phenotype in F0 embryos. (A) The gRNA was designed against the 5’ region of exon 3 of lpar2b genomic DNA. (B) Sequencing of the genomic DNA extracted from F0 embryos injected with the gRNA and Cas9 mRNA. (C) Fluorescence images of control Et(gata2:EGFP)mp189b embryos injected with Cas9 mRNA alone, and embryos injected with lpar2b gRNA and Cas9 together at 48 hpf. (D) Quantification of the percentage of embryos with normal pLLP migration but fewer NMs (< 5 trunk NMs) at 48 hpf. |
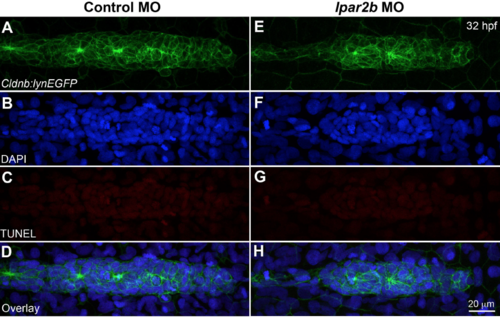
Lpar2b knock-‐down does not increase cell apoptosis in the pLLP. (A-‐H) Confocal images showing the pLLP after TUNEL staining (red) in control-‐ (A-‐D) or lpar2b MO-‐injected (E-‐H)Tg(-‐8.0cldnb:lynEGFP) embryos at 32 hpf. Cell nuclei were stained with DAPI (blue). Rarely any TUNEL+ cell (red) can be observed in the pLLP in both groups. |
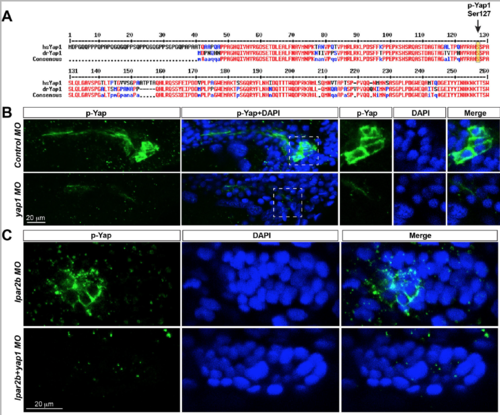
Validation of the p-‐Yap1 antibody used in the study. (A) Alignment of the N-‐terminal amino acid sequences of human (hsYAP1) and zebrafish Yap1 (drYap1) proteins. High concensus sequences (>90%) are shown in red, and low concensus sequences (>50%) are depicted in blue. Arrow, the Ser127 phosphorylation site recognized by the antibody. (B)Confocal images of the pronephric duct region stained with p-‐Yap1 and DAPI in 32 hpf embryo injected with control-‐ of yap1 MO. Images in the left 2 panels are generated from maximum projection of 6 confocal z-‐stacks. A single z-‐stack of the boxed areas is depicted in the right 3 panels. Note the p-‐Yap1 signal is in the cytoplasm and does not overlap with the nucleus. (C) Confocal images of the pLLP cells stained with p-‐Yap1 and DAPI in embryos injected with indicated MOs. The p-‐Yap1 signal is in the cytosol of pLLP cells. |