
- Title
-
Placeholder Nucleosomes Underlie Germline-to-Embryo DNA Methylation Reprogramming
- Authors
- Murphy, P.J., Wu, S.F., James, C.R., Wike, C.L., Cairns, B.R.
- Source
- Full text @ Cell
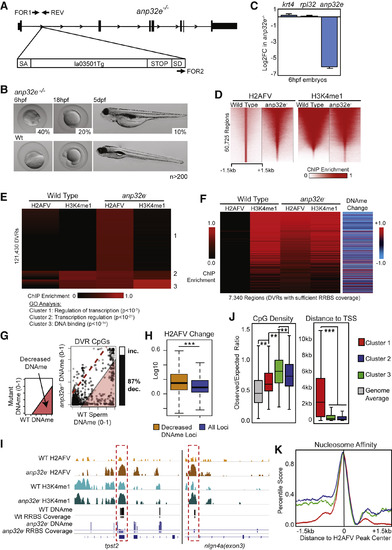
A Null Mutation for anp32e Causes Increased Genomic H2AFV and Decreased DNA Methylation in Sperm (A) Scheme for the anp32e mutant allele. A gene trap cassette (la013501Tg) within the anp32e gene causes premature translation termination. PCR primers are indicated. (B) anp32e−/− homozygotes display a variety of phenotypes. Lethality occurs at the displayed stages. 30% are viable and fertile. (C) anp32e mRNA in the anp32e mutants. An early zygotically transcribed gene (krt4) and a housekeeping gene (rpl32) are unaffected. Error bars represent SD. (D) H2AFV enrichment regions become more broad in anp32e− sperm. Heatmaps for H2AFV and H3K4me1 (normalized enrichment) are displayed at all WT sperm H2AFV peaks. (E) anp32e− sperm display ectopic H2AFV localization. H2AFV and H3K4me1 enrichment (Z scores) is displayed as a heatmap. Differential variant regions (DVRs) were analyzed and segregate into 3 clusters by K-means clustering. Results of GO analysis for affected gene categories is shown below. (F) Heatmaps indicate DNA methylation decreases at the majority of DVRs. Displayed regions are only those with sufficient read depth from RRBS-seq assays (see the STAR Methods). (G) Individual CpGs within DVRs indicate decreased DNAme. Scatterplot of mutant versus control is displayed with a bar graph quantifying changing CpGs (>20% absolute change), and the percentage decreasing DNA methylation is shown. (H) H2AFV increases more at regions at which DNA methylation decreases. Boxplots of log10FE values are shown. ∗∗∗ p < 0.001. (I) Browser snapshots are displayed for WT and anp32e− sperm. Regions with sufficient coverage for DNA methylation data are indicated with bars beneath each track. Ectopic H2AFV accumulation is highlighted with red dashed boxes. log10FE data are from 0–1 for ChIP-seq and DNA methylation fraction from 0–1. (J) Analysis of CpG density (left) and neighboring gene proximity distance (right) for clusters identified in (E). t tests: ∗∗ p < 0.01, ∗∗∗ p < 0.001. Boxplots are displayed. (K) Analysis of predicted nucleosome affinity at DVRs. Regions from (E) were grouped by cluster and colored like in (J). See also Figure S2. |
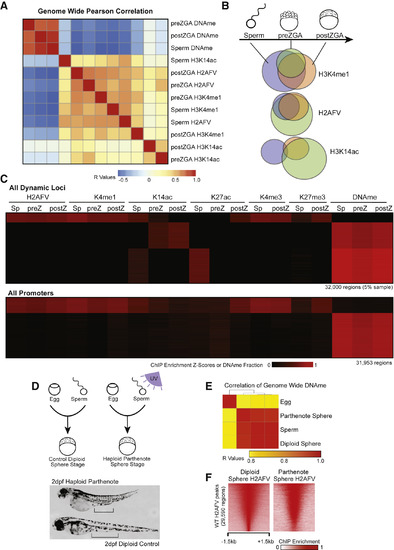
Maintenance of H2AFV and H3K4me1 at DNA Hypomethylated Regions in Zebrafish Embryos (A) Correlation of Placeholder candidates in sperm and embryos. Pearson correlation R values are displayed, and the order was determined by the clustering in Figure S3C. (B) Maintenance of Placeholder candidates during sperm-to-embryo transition. Venn diagrams indicate overlap of called peaks comparing sperm (blue), preZGA (green), and postZGA (red) samples. (C) Heatmaps for epigenetic marks in sperm and embryos. Displayed are dynamic loci at which epigenetic marks change during development (top) and promoter regions (bottom). (D) Haploid parthenogenesis by UV irradiation. Top: in vitro fertilization resulted in phenotypically WT or haploid embryos dependent on UV treatment. Bottom: 2-day-old haploid embryos were shorter with reduced intestinal length, as indicated by the black bars. (E) DNAme reprogramming is normal in gynogenetic haploids. Genome-wide RRBS revealed DNA methylation in haploids is similar to sperm. Displayed is a heatmap for Pearson correlations. (F) H2AFV patterns in gynogenetic embryos are normal. Haploid H2AFV at WT H2AFV peaks is highly similar to normal embryos. Displayed is a heatmap of normalized enrichment. |
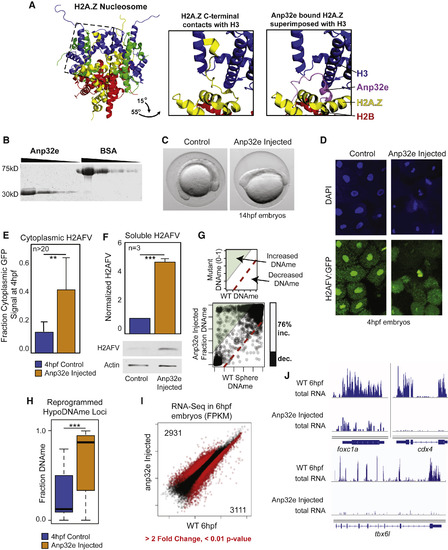
Anp32e Protein Injection Causes Reduced Nuclear H2AFV and Increased DNA Methylation (A) Anp32e binding inhibits H2A.Z within the nucleosome. Left: crystal structure for the nucleosome octamer containing mouse H2A.Z (yellow) (Suto et al., 2000). Middle: zoomed-in and rotated view of the H2A.Z nucleosome octamer (dashed box from left), where the C terminus of H2A.Z interacts with histone H3. Right: the same view as middle panel, with the superimposed H2A.Z bound to human ANP32E (Obri et al., 2014). (B) Purification of recombinant zebrafish Anp32e protein. A comparison to BSA and Coomassie staining to demonstrate purity. (C) Phenotype of early somite-staged zebrafish following Anp32e protein injection. (D) H2AFV signal is depleted in nuclei following Anp32e injection in embryos. DAPI and H2AFV:GFP localization in cells from sphere-staged (4hpf) embryos. Injection was into 1-cell embryos. (E) Microscopy-based quantification of H2AFV following Anp32e injection. Fraction H2AFV:GFP signal in control and injected embryos like in (D). t tests: ∗∗ p < 0.01 (F) Quantification of H2AFV in cellular fractions resulting from Anp32e injection. Western blotting for soluble H2AFV indicates that Anp32e injection causes increased cytoplasmic H2AFV. t tests: ∗∗∗ p < 0.001. (E and F) Error bars represent SD. (G) Anp32e injection causes increased DNAme. Scatterplot of CpGs for treatment versus control is displayed, with a bar graph quantifying changing CpGs (>20% absolute change). (H) Changes in DNA methylation are most significant at regions at which DNA is normally demethylated. t tests: ∗∗∗ p < 0.001. Boxplots are displayed. (I) A scatterplot of gene transcript abundance (fragments per kilobase of million mapped reads [FPKM]) for Anp32e-injected embryos compared to control samples. Red data points indicate fold change >2 and p < 0.01 false discovery rate (FDR). The number of genes changing is indicated in the top-left and bottom-right corners. (J) A gallery of browser snapshots for total RNA at developmentally regulated genes. See also Figure S4. |

ZFIN is incorporating published figure images and captions as part of an ongoing project. Figures from some publications have not yet been curated, or are not available for display because of copyright restrictions. |
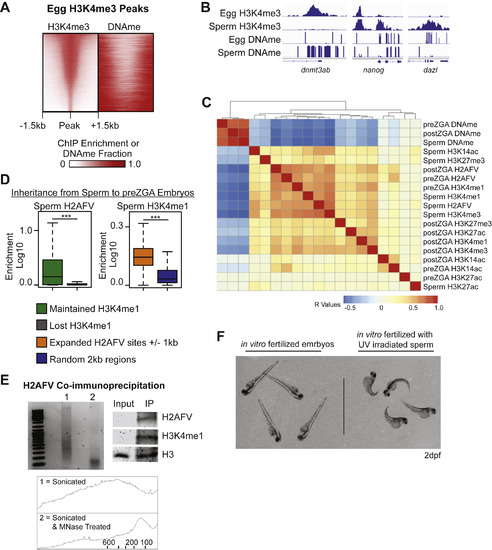
H2AFV and H3K4me1 Mark DNA Hypomethylated Regions in Zebrafish Cleavage Embryos, Related to Figure 3 (A) Heatmaps of H3K4me3 and DNA methylation at egg H3K4me3 peaks, indicating the two epigenetic marks rarely coincide. Zebrafish H3K4me3 egg data from Zhang et al., 2016. (B) Browser snapshots of enrichment for H3K4me3 and DNA methylation in sperm and eggs. H3K4me3 marks many promoters, but is absent from the promoters of transcription factor genes in eggs which also have moderate to high DNA methylation in eggs. Normalized read depth for ChIP-Seq data and DNA methylation fraction (0-1). (C) Clustering of pairwise Pearson correlation R values for all epigenetic features assayed in sperm, and in pre- and post-ZGA embryo samples. H2AFV and H3K4me1 are most strongly correlated with one another and anti-correlated with DNAme. (D) Maintenance of epigenetic marks during transition from sperm to preZGA embryos occurs at regions marked by H2AFV and flanked by H3K4me1 domains. Left – enrichment of H2AFV was measured at sites where H3K4me1 is lost compared to where it is maintained from sperm to embryos. Right – H3K4me1 is enriched where H2AFV expands in preZGA embryos as compared to control loci. H2AFV flanking regions were defined as peaks ± 1kb. t tests: ∗∗∗ = p < 0.001. (E) H3K4me1 co-immunoprecipitates with H2AFV in preZGA embryos. Left - the DNA fragment size distribution for chromatin from preZGA embryos indicated that primarily mononucleosomes were used. Both an agarose gel image and the quantification of fragment size distribution (x axis = bp, and y axis = frequency) by ImageJ (bottom) are displayed. Top Right - western blot for H2AFV and H3K4me1 with H3 as a loading control. (F) Gynogenetic embryos at 2 days post fertilization (dpf) compared to control embryos, which were generated in parallel using non-irradiated sperm. 100% of embryos at 2dpf displayed the expected phenotype (n > 30). |
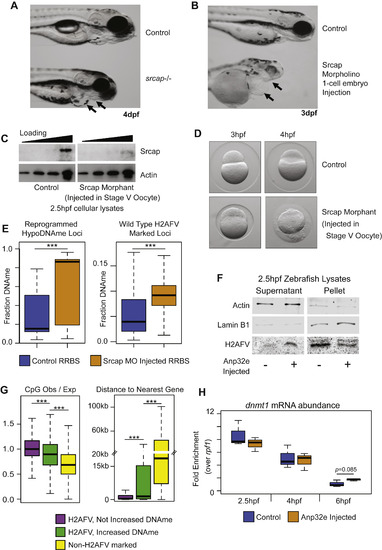
Srcap Reduction Coincides with Increased DNA Methylation, Related to Figure 4 (A) Phenotype of zygotic null srcap−/− mutant fish compared to wild-type at 4dpf. Arrows indicate recessed jaw, and enlarged heart in mutant embryos. (B) Similar to (A), except phenotypic characterization of embryos injected with an Srcap morpholino. Embryos are at 3dpf. As in (A), arrows indicate a recessed jaw and enlarged heart. (C) A western blot for Srcap abundance comparing cellular lysates from control 2.5hpf embryos to lysates from embryos that resulted from in vitro fertilization of oocytes injected with an srcap morpholino. (D) srcap morphants from stage V oocyte injection are modestly impaired at 3hpf, but have gross morphological defects at 4hpf - immediately following zygotic genome activation. (E) RRBS-Seq DNA methylation analysis of srcap morphants compared to control embryos for loci which undergo DNA demethylation on the maternal allele under wild-type conditions (left), and for all wild-type H2AFV marked loci (right). (F) Western blots indicate H2AFV decreases in the nuclear fraction and increases in the cytoplasmic fraction of cells purified from embryos that were injected with Anp32e – as in Figure 4F. (G) Measurements of CpG density (left) and proximity to the gene promoters (right) for regions parsed by changes in DNA methylation after Anp32e injection. Regions were either marked by H2AFV in WT (violet and green) or lacked H2AFV (yellow). H2AFV marked loci were further parsed based on whether DNA methylation increased (green). t tests: ∗∗∗ = p < 0.001 (H) At 6hpf we observed a modest increase in dnmt1 expression resulting from Anp32e injection. This was not the case at 2.5 or 4hpf. Overall dnmt1 expression decreased during progression of cleavage phase. |
Reprinted from Cell, 172(5), Murphy, P.J., Wu, S.F., James, C.R., Wike, C.L., Cairns, B.R., Placeholder Nucleosomes Underlie Germline-to-Embryo DNA Methylation Reprogramming, 993-1006.e13, Copyright (2018) with permission from Elsevier. Full text @ Cell