
- Title
-
Mutation of IFNLR1, an interferon lambda receptor 1, is associated with autosomal-dominant non-syndromic hearing loss.
- Authors
- Gao, X., Yuan, Y.Y., Lin, Q.F., Xu, J.C., Wang, W.Q., Qiao, Y.H., Kang, D.Y., Bai, D., Xin, F., Huang, S.S., Qiu, S.W., Guan, L.P., Su, Y., Wang, G.J., Han, M.Y., Jiang, Y., Liu, H.K., Dai, P.
- Source
- Full text @ J. Med. Genet.
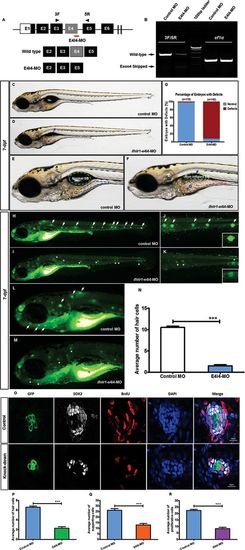
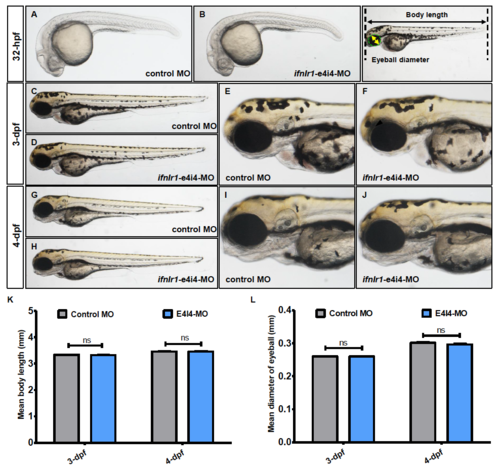
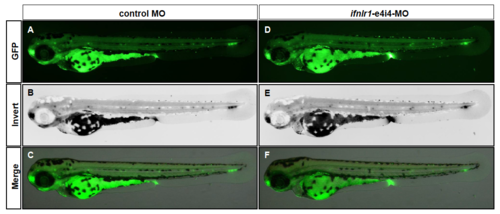
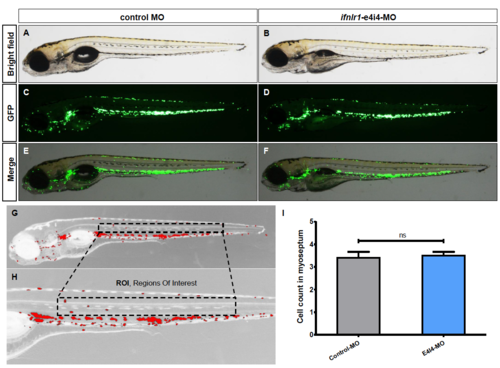
Phenotypes of ifnlr1 zebrafish morphants. (A,B) Effectiveness of ifnlr1 knockdown was confirmed by RT-PCR. (A) The zebrafish ifnlr1 gene was targeted by specific MO antisense to prevent the appropriate splicing of exon 4 (E4I4-MO). Primers 3F and 5R detected the presence of WT (non-mutant) transcripts or those in which exon 4 had been skipped. The diagram below is a schematic depiction of the exon 4-skipped transcript in the E4I4-MO-injected embryos compared with control embryos. (B) RT-PCR of ifnlr1 transcript from control-MO and E4I4-MO MO-injected embryos at 4 dpf demonstrates skipping of exon 4. Injection of 4 ng of ifnlr1 MO altered the splicing between exon 4 and intron 4, as revealed by a shift in PCR bands between control (249 bp) and ifnlr1 MO-injected embryos (67 bp). (C–G) At late stages, knockdown ifnlr1 caused non-inflation of the SB (F, blue arrow) and expansion of the gut lumen area (F, red dashed lines). The bar graph in Panel G shows the percentage of embryos with development defects at 7 dpf. (H–N) ifnlr1 knockdown induces potent neuromasts loss in zebrafish. Control embryos and embryos injected with 4 ng ifnlr1-e4i4-MO were stained with the mitochondrial potentiometric dye DASPEI at 7 dpf. Neuromasts stereotypically located on the lateral line were stained as green dots (H,J: white arrow). Control MO-injected zebrafish had normal numbers of neuromasts. In contrast, significantly decreased hair cell staining (I,K: asterisk) and head neuromast staining (L: white arrow; M: asterisk) were observed in ifnlr1 morphants. Fluorescent DASPEI images were inverted for particle analysis. The fluorescence particle signals of neuromasts were quantified using morphometric analysis. (O) Hair cells, supporting cells and proliferated cells per neuromast were counted and analysed in 6dpf Tg (Brn3c:mGFP). Transgenic zebrafish larvae using four markers GFP (hair cells, green), SOX2 (supporting cells, white), BrdU (proliferated cells, red) and DAPI (nucleus, blue). Four dpf embryos were exposed to BrdU for 48 hours and visualised the cell proliferation. There were fewer hair cells, supporting cells and proliferated cells in morphants than WT. (N,P–R) Quantification of the average number of neuromasts (N), hair cells (P), support cells (Q) and proliferated cells (R) shows significantly decrease in ifnlr1 morphants. Error bars, SEM; ***P<0.0001 (n=10; Student’s t-test). BrdU, bromodeoxyuridine; DASPEI, 2-(4-(dimethylamino)styryl)-N-ethylpyridinium iodide; dpf, days postfertilisation; E, ear; H, heart; L, liver; MO, Morpholino; SB, swim bladder; WT, wild type. |
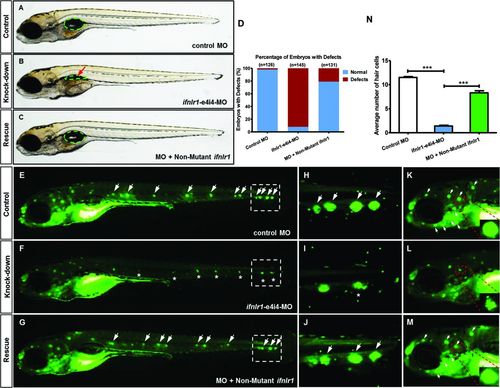
Coinjection of ifnlr1 mRNA from non-mutant zebrafish rescued the phenotypes of non-inflated SB, hair cell loss and head neuromast loss (6 dpf) induced by ifnlr1-e4i4-MO. (A) Lateral views of control MO injected zebrafish embryos. (B) Embryos injected with ifnlr1 MO oligonucleotides (MO), ifnlr1 MO, plus non-mutant zebrafish ifnlr1. (C) Coinjection of non-mutant zebrafish ifnlr1 mRNA rescued non-inflated SB (red arrow) in ifnlr1 morphants at 6 dpf. (D) The bar graph shows the percentage of embryos with developmental defects. (E–N) Defective neuromasts in zebrafish. DASPEI (green) labelled neuromasts at 6 dpf. Neuromasts were stained as green dots (white arrow). The boxed regions are shown at higher magnification (right panels). (E,H,K) Control MO-injected zebrafish had normal numbers of hair cells. (F,I,L) Significantly decreased neuromast staining (asterisk) was observed in ifnlr1 morphants. (G,J,M) Coinjection of ifnlr1 mRNA from non-mutant zebrafish rescued ifnlr1-e4i4-MO from inducing hair cell loss and head neuromast loss (white arrow). Fluorescent DASPEI images were inverted for particle analysis. (N) The fluorescence particle signal in neuromasts was quantified using morphometric analysis. Quantification of the average number of neuromasts in the control embryos and the embryos injected with ifnlr1 MO or ifnlr1 MO plus non-mutant zebrafish ifnlr1. Error bars, SEM; ***P<0.0001 (n=10; ANOVA). DASPEI, 2-(4-(dimethylamino)styryl)-N-ethylpyridinium iodide; MO, Morpholino; SB, swim bladder. PHENOTYPE:
|

ZFIN is incorporating published figure images and captions as part of an ongoing project. Figures from some publications have not yet been curated, or are not available for display because of copyright restrictions. |
|
PHENOTYPE:
|
PHENOTYPE:
|