
- Title
-
Extraocular muscle regeneration in zebrafish requires late signals from Insulin-like growth factors
- Authors
- Saera-Vila, A., Louie, K.W., Sha, C., Kelly, R.M., Kish, P.E., Kahana, A.
- Source
- Full text @ PLoS One

Inhibition of Igf1r impairs muscle regeneration. Myectomized α-actin-EGFP fish treated with the Igf1r inhibitor BMS754807 (B) or DMSO (A) for 5 days. At selected time points (3, 5, and 7 dpi), the length of the regenerating muscle was measured as described (C), values are averages ± SD (n = 5–6). For each group (DMSO or BMS754807), differences among time points were analyzed by ANOVA. Different letters (lower case over DMSO group, there was no statistically significant difference for the BMS754807 group) indicate significant differences among time points (P < 0.05, Newman-Keuls multiple comparisons test). For each time point, differences between DMSO and BMS754807 treated fish were analyzed by Student’s t-test (*p < 0.05; **p < 0.01; ***p <0.001). To confirm our findings, α-actin-EGFP were treated with the unrelated NVP-AEW541 Igf1R inhibitor. At 4 dpi the regenerating muscle was measured as before showing similar results (D); values are averages ± SD (Student's t-test, **p < 0.01, n = 5). To knock down Igf1r, lissamine-tagged MOs (red) against both Igf1r paralogs (a and b) were microinjected into α-actin-EGFP (green) fish muscles prior myectomy. MOs were detected through the whole regenerating muscle, including the distal ends (arrowhead). Control MO (up) and Igfra/b MO (down) injected fish are shown (E). The length of the regenerating muscle was measured as described (F); values are averages ± SD (Student’s t-test, *p < 0.05, n = 10). Diagram of a craniectomized zebrafish head (G); muscles visualized by this technique are shown, and LR muscles are highlighted in green. Green and red boxes show approximately the picture used for regeneration or LysoTracker Red and GFP-Lc3 (shown in Fig 2) assessment, respectively. The white arrows mark the growing end of the regenerating muscle. P, pituitary; e, eye. Gray box in panels C, D and F represent the 50% muscle length as baseline following myectomy. |
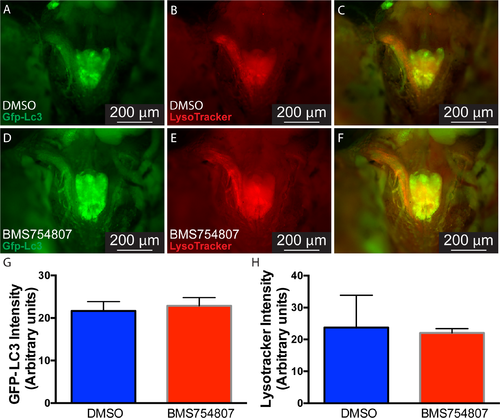
Inhibition of Igf signaling does not affect autophagy activation in the regenerating muscle. GFP-LC3 (A and D) fish were myectomyzed and LysoTracker Red (B and E) was used to label autophagy in the regenerating LR in fish treated with DMSO (A-C) or BMS754807 (D-F). C and F show the merging of A-B and D-E, respectively. GFP-LC3 (G) and LysoTracker (H) fluorescence intensity of the regenerating muscle were measured and no statistically significant difference between DMSO and BMS754807 treated fish was found. Values represent average ± SD (Student’s t-test, significance set at P < 0.05, n = 5). P, pituitary. |

Inhibition of Igf signaling does not modify cell proliferation in the regenerating muscle. The role of Fgf in cell proliferation was assessed at 27 hours post-injury treating fish with DMSO or BMS754807 (A). DAPI, blue; EdU, red. Cell proliferation in the injured muscles from DMSO or BMS754807 treated fish was not statistically different (B). Values represent average ± SEM (Student’s t-test, significance set at P < 0.05, n = 4). |
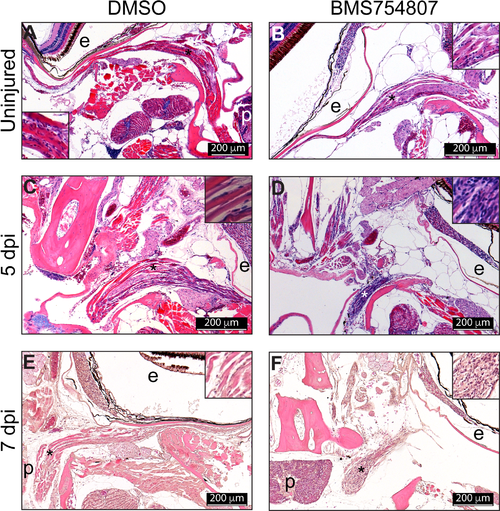
Histological analysis of the regenerating muscle. Paraffin sections (5 μm) H&E staining of regenerating muscles from DMSO (A, C) and BMS754807 (B, D) treated fish. Sections of regenerating muscle at 5 (A, B) and 7 dpi (C, D). The asterisk marks the approximate position of the inset. Images are representative examples from 5 fish analyzed per treatment and time point. P, pituitary; e, eye. The S1 Fig shows a zebrafish coronal section diagram as a reference for the position of the pictures shown in this figure. |

Myosin staining of the regenerating muscle. The effect of Igf signaling inhibition on EOM regeneration was analyzed using myosin expression as a marker of muscle differentiation. Uninjured EOMs of BMS754807 treated fish showed high levels of myosin staining (A, B), that were not different of those of a DMSO treated control fish. Myosin staining (yellow) of DMSO control fish at 5 dpi (E, F) and 7 dpi (M, N) reveal higher protein levels than the myosin staining of BMS754807 treated fish at 5 dpi (I, J) and 7 dpi (Q, R). The dashed box shows the approximate position of the magnification shown in B, F, J, N and R. DAPI staining of the corresponding myosin staining picture (C, G, K, O and S) and DIC images (D, H, L, P and T) are also shown. DAPI staining shows hypercellularity in BMS754807 (K, S compared to C, G, O) and typical elongated muscle nuclei in DMSO 7 dpi (O) and Uninjured EOMs (C). Pictures are representative examples of 7 fish per group, time and treatment. |