
- Title
-
Early development of the enteric nervous system visualized by using a new transgenic zebrafish line harboring a regulatory region for choline acetyltransferase a (chata) gene
- Authors
- Nikaido, M., Izumi, S., Ohnuki, H., Takigawa, Y., Yamasu, K., Hatta, K.
- Source
- Full text @ Gene Expr. Patterns

Expression of chata but not chatb genes in the larval zebrafish gut and the construct used to create the transgenic line Tg(chata:GGFF2). A–M: Whole mount in situ hybridization for chata (A–E), chatb (F–I) and nos1 (J–M). The developmental stages are at the top right of each panel. Scale bar: 100 μm. All panels but E are left-side views, and the gut at the level of mid-intestine (black bracket) flanked with the anterior half of the yolk extension (yolk ext.) is shown. Anterior: to the left. In most of the samples chata was not detected in the gut, but in some cases a very weak signal was observed after 72 hpf (panels C, D: black arrowheads). Embryo in E, dorsal view of the head, with anterior to the top. Cranial motor nuclei (which showed a strong signal for chata) are indicated with Roman numerals. In the gut, no signal was detected for chatb (F–I), whereas a strong signal was detected for nos1 in the gut after 60 hpf (K,L,M). N: RT-PCR results for chata, chatb and nos1. "4d" and "6d": The cDNAs from 4- and 6-dpf gut, respectively. "W": The cDNA from whole embryos at 5 dpf. The expected sizes of amplified chata and chatb cDNAs (yellow arrowheads) and the nos1 (white arrowheads) are shown. We detected chata expression, but not chatb, in the developing gut, and both chata and chatb amplified cDNA were found in lane W. nos1 was detected in all lanes. O: A schematic drawing of the construct used to create the transgenic line pTol2 + GGFF-chat 1.5k. The 1.5-kb upstream regulatory region for chata was ligated to gfp-gal4ff fusion (GGFF) cDNA followed by poly A, flanked by Tol2 recognition sites (Tol2-L, R). |

Expression pattern of GFP in the Tg(chata:GGFF2). A: Distribution of GFP + cells as a pair of one-dimensional rows in the anterior gut primordium at 60 hpf. These cells were restricted anteriorly to the 8th somite (arrow). Panels A, B, D are lateral projection views. Anterior: to the left. B: At 72 hpf, the distribution of GFP + cells as a pair of one-dimensional rows was expanded to near the posterior end of the gut. C: Frontal projection view made from the same data as those in panel B shows bilaterally distributed GFP + cells (arrowheads). D: At 5 dpf, at the level of distal intestine, GFP + cells were distributed around the developed gut tube. E, F: At 3 dpf, the dorsal views with anterior to the top show GFP is expressed in retinal ganglion cells and optic nerves, trigeminal ganglia, and posterior lateral line ganglia. G: The posterior lateral line nerve is GFP + at 60 hpf. H, I: At 3 dpf, dorsal root ganglia and Rohon-Beard neurons are GFP+ in addition to neurons in the spinal cord in trunk. 8s: 8th somite, DRG: dorsal root ganglia, no: notochord, oc: optic chiasm, pLLg: posterior lateral line ganglia, pLLn: posterior lateral line nerve, r: retina, RB: Rohon-Beard neurons, tri: trigeminal ganglia, sc: spinal cord, yolk ext.: yolk extension. Scale bars: 50 μm. |

Immunostaining of HuC/D and GFP in the gut of Tg(chata:GGFF2) at embryonic, larval and adult stages. A–F": The expression of GFP is shown in the top row (A–F), that of HuC/D in the middle row (A′–F′), and merged images in the bottom row (A″–F″). The stages are shown at the top right. HuC/D was expressed in most GFP + cells (white arrowheads) at all stages examined, whereas some GFP + cells were HuC/D− (green arrowheads), and some HuC/D+ cells were GFP− (magenta arrowheads). GFP + cells with very weak HuC/D found at 60 hpf (A) are indicated by green arrowheads outlined with white. GFP + cells were decreased in the young (1.5-month-old) adults (E), and not found in mature (∼1-year-old) adults (F). We found that 96% of the GFP + cells were HuC/D+ at 6 dpf (n = 6 animals, 346/360 cells) and that 88% of the GFP + cells were HuC/D+ at 12 dpf (n = 7, 383/434 cells) (B-B″ and C-C″). In the 1.5-month-old adults (E-E″), 100% of the GFP + cells were HuC/D+ (n = 2 fish, 107/107 cells), and the percentage of GFP + cells among HuC/D+ cells was 33% (n = 2, 107 GFP+/326 HuC/D+ cells), which is a much smaller percentage than that observed at 12 dpf (60%, n = 7, 383 GFP+/639 HuC/D+ cells). In the 1-year-old adults (F-F″), only 0.5% of the HuC/D+ cells were GFP+ (n = 2, 2 GFP+/433 HuC/D+). Anterior: to the left. White dotted lines in B″ outline the gut. For A-C and E-F, scale bar in F": 50 μm. For D-D″, scale bar in D″: 20 μm. |
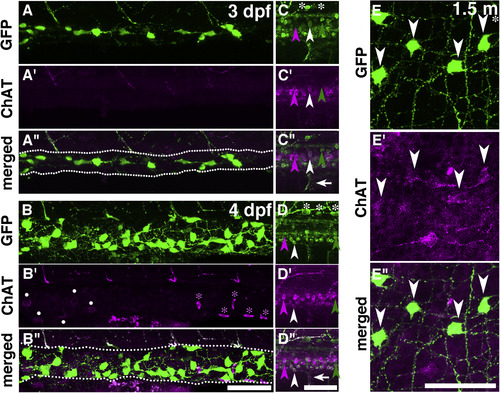
Immunostaining of ChAT and GFP in the gut and CNS of Tg(chata:GGFF2) larvae and young adults. The expression patterns of GFP (A–E), ChAT (A′–E′) and merged images (A″–E″) in 3-dpf (A,C), 4-dpf (B,D) and 1.5-month-old (E) fish are shown. In the gut of 1.5-month old fish (E), 66% of GFP + cells were ChAT+, whereas ChAT immunostaining was not detected in the guts at 3 and 4 dpf (A,B). The expressions of GFP (green arrowheads), ChAT (magenta arrowheads), and both GFP and ChAT (white arrowheads) are shown. Some cells expressed only ChAT or GFP. White asterisks: Rohon-Beard neurons. White arrows: Motor axons expressing GFP and ChAT. White dots: Unknown cells outside of the gut. Magenta asterisks: Blood cells. Anterior, to the left. Dorsal, to the top for 3- and 4-dpf embryos. Dotted lines in A″ and B″ are outlines of gut. Scale bars: 50 μm. |

Immunostaining of 5-HT or Nos1 with GFP in the gut of Tg(chata:GGFF2) larvae. Some of the GFP + cells expressed either 5-HT or Nos1. Double staining of GFP and 5-HT (A–D) or, GFP and Nos1 (E–H) is shown. The expression patterns of GFP (A–D), 5-HT (A′–D′) and merged images (A″–D″) at 3 dpf (A), 4 dpf (B), 6 dpf (C) and 12 dpf (D) are shown. Green arrowheads: GFP + cells. Magenta arrowheads: 5-HT + cells. White arrowheads: GFP/5-HT double + cells. Anterior, to the left. The cells marked with 'e' in panels A′ and B′ are enterochromaffin cells. The data for Nos1 are presented as for 5-HT. The ratio of 5-HT+/GFP + cells in the GFP + cells and the ratio of Nos1+/GFP + cells in the GFP + cells did not change during the 3-dpf to 12-dpf stages and were 22%–32% for 5-HT and 37%–53% for Nos1. See the text for the details. Scale bar: 50 μm. |

Time-lapse imaging analysis of GFP + cells in the gut of Tg(chata:GGFF2). A: A double in situ image of crestin and gfp at 53 hpf. Red signals of crestin reveal the enteric neural crest cells that migrate from anterior to posterior as a pair of rows of cells (white arrows). Spotty gfp signals (brown signals indicated by arrowheads) are located among the neural crest cells. The black asterisks indicate crestin + cells outside of the gut, which may be precursors of pigment cells. Ventral view. Anterior, to the left. Scale bar: 50 μm. B–F: Live imaging of Tg(chata:GGFF2). Snapshots of Suppl. Movie S1 at 60 hpf (B) and 72 hpf (C) and Suppl. Movie S3 at 86 hpf (D) and 97 hpf (E). GFP + cells that were already present at the beginning of the movie are marked by white numbers, and newly appeared GFP + cells in the movie are marked by magenta numbers. Cell Nos. 1 and 7 in panel B disappeared during observation (marked by white Xs). Cell Nos. 26–28 and Nos. 33 and 34 (gray numbers) were undistinguishable from No. 9 and No. 11 at the first time point, respectively. Brightest cells are marked with No. 9 and 11 at the last time point, and others are labeled with Nos. 26–28 and Nos. 33, 34 in gray. The white asterisks in panels B and D mark GFP + neurites from outside of the gut. Green dotted lines in panels D and E outline the guts. Ventral views for panels B and C, left-side views for panels D and E, with anterior to the left. F: A schematic drawing showing the correspondence of all GFP + cells in panels D and E. The GFP + cells from the beginning are connected with blue-dotted lines, newly appeared GFP + cells are in magenta, and the GFP + cells that were undistinguishable with No.9 and 11 described above are in gray. Scale bars: 50 μm. G–Q: Serial photos of migrating cell No. 42, moving anteriorly (G–J) and No. 22, moving in a zig-zag manner (L–O) taken at indicated time points. The white arrowheads point to the migrating cells of interest. The white triangles in panels G and L indicate the GFP + processes along which the cells migrated. Panels (K) and (P) summarize the trajectories for migrating cells No. 42 and No. 22, respectively. Scale bar: 10 μm. Q: The directions of migration for the 13 cells presented in Suppl. Movies S3 and S4. Green arrows: Anterior migration. Blue arrows: Posterior migration. Magenta arrows: Zig-zag migration. The time taken for each migration is shown at the end of the arrows. Scale bar: 10 μm. |
Reprinted from Gene expression patterns : GEP, 28, Nikaido, M., Izumi, S., Ohnuki, H., Takigawa, Y., Yamasu, K., Hatta, K., Early development of the enteric nervous system visualized by using a new transgenic zebrafish line harboring a regulatory region for choline acetyltransferase a (chata) gene, 12-21, Copyright (2018) with permission from Elsevier. Full text @ Gene Expr. Patterns