
- Title
-
Spatially resolved RNA-sequencing of the embryonic heart identifies a role for Wnt/β-catenin signaling in autonomic control of heart rate
- Authors
- Burkhard, S.B., Bakkers, J.
- Source
- Full text @ Elife
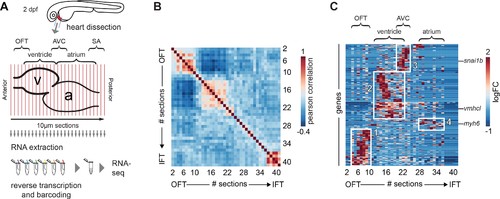
Tomo-seq on isolated embryonic hearts reveals distinct clusters of gene expression. (A) Hearts were isolated from 2-day-old embryos and 10 μm sections were made along the anterior-posterior axis, from outflow to inflow pole. Each section was collected in an individual tube followed by RNA isolation and cDNA transcription using section specific barcodes. After that, samples were pooled for linear amplification and sequence library preparation. (B) Pairwise correlation between individual sections across all genes detected at more than 20 reads in at least two sections. + 1 equals total positive correlation, 0 no correlation, −1 total negative correlation. Blocks of correlating sections can be observed. (C) Hierarchical cluster analysis of gene expression per section. Distinct gene expression clusters correspond to different regions of the heart shown in boxed areas: 1. arterial pole/OFT; 2. Ventricle; 3. AV canal; 4. Atrium. RNA sequencing reads per gene were normalized against the total read count per section as well as the total spike-in control RNA read counts. Genes expressed in min three sections z-value >1.25. See also Figure 1—figure supplement 1 and Figure 1—source data 1. |
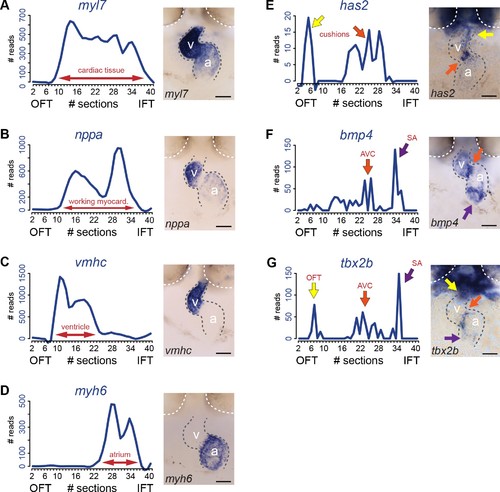
Transcriptome map of the embryonic heart with high spatial resolution. (A–E) Tomo-seq expression traces and corresponding in situ hybridization for (A) myl7 (whole myocardium), (C) vmhc (ventricular myocardium), (D) myh6 (atrial myocardium), (E) has2 (endocardial cushions), (F) bmp4 (AVC myocardium, orange arrow; IFT myocardium, purple arrow) and (G) tbx2b (OFT myocardium, yellow arrow, AVC myocardium, orange arrow; IFT myocardium, purple arrow). Smoothening (LOESS) was applied to graphs A-E, span α = 0.3. Anterior up. Gray dashed line outlines the heart. White dashed line outlines the eyes. A, atrium; V, ventricle; AVC: atrioventricular canal; IFT, inflow tract; OFT, outflow tract; SA, sinoatrial region. Scale bars represent 50 μm. EXPRESSION / LABELING:
|
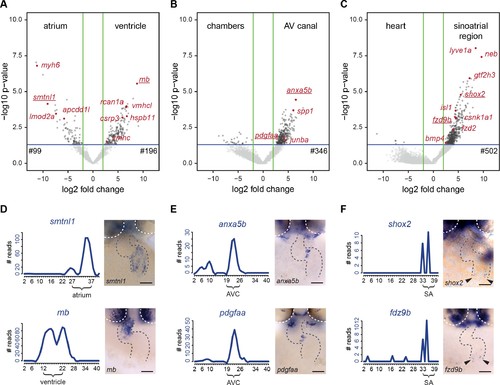
Differentially expressed genes in cardiac sub-compartments. (A–C) Volcano plots highlighting genes differentially expressed in the (A) atrium (n = 99) and ventricle (n = 196), (B) AV canal (n = 346) and (C) sinoatrial region (n = 502). Grey and red dots represent individual genes. Green lines indicate threshold of log2 fold change >2. Blue lines indicate threshold of p-value<0,05. (D–F) Expression traces and in situ hybridization analysis for representative example genes (gene names underlined in volcano plots) significantly upregulated in (D) atrium (smtnl1) and ventricle (mb), (E) AV canal (anxa5b and pdgfaa) and in the sinoatrial region (shox2 and fzd9b). Smoothening (LOESS) was applied to graphs D and E, span α = 0.2. Gray dashed line outlines the heart. White dashed line outlines the eyes. Anterior up. Scale bars represent 50 μm. See also Figure 4—figure supplement 1 and Figure 4—source data 1. EXPRESSION / LABELING:
|
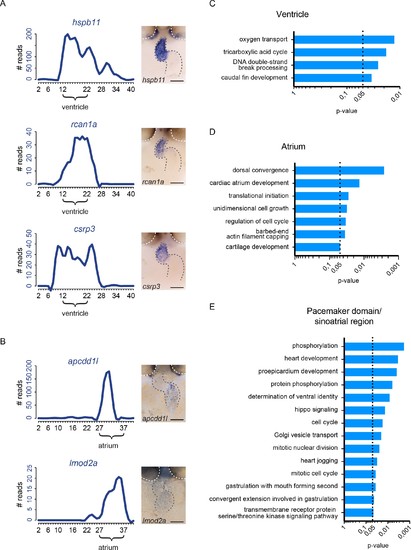
Identification of region-specific gene expression patterns. (A–B) Additional gene expression plot and ISH analysis for representative example genes significantly upregulated in the ventricle (hspb11, rcan1a, csrp3) and atrium (apcdd1l, lmod2a). Gray dashed line: location of the heart. White dashed line outlines the eyes. Anterior to the top. (C–E) GO term enrichment for genes significantly enriched in the ventricle (C), atrium (D) and pacemaker domain (E). Smoothening (LOESS) was applied to graphs A and B, span α = 0.2. p-value<0.05. Scale bars represent 50 μm. EXPRESSION / LABELING:
|
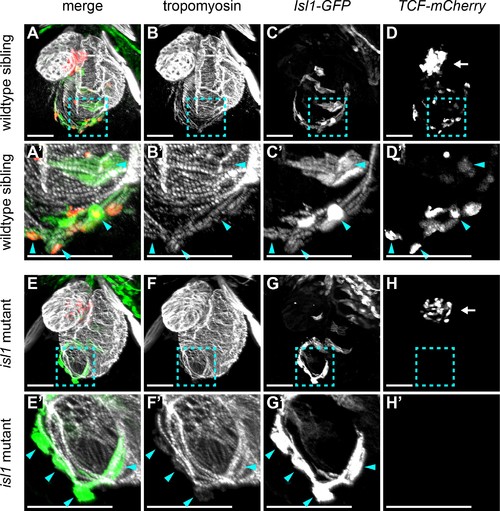
Wnt/β-catenin signaling in cardiac pacemaker cells. 3D reconstructions of confocal scans from whole mount embryos containing the tg(7xTCFXla.Siam:nlsmCherry) (reporting Wnt/β-catenin activity in red) and the tg(Isl1:GFF;UAS:GFP) (reporting isl1 expression and marking pacemaker cells in green) and stained for tropomyosin (myocardium in white). Anterior is up and posterior is down. Wild-type sibling (A-D’) and isl1K88X mutant (E-H’) embryos at 3 dpf. The blue dashed line boxes in A-D and E-H indicate the sinoatrial region shown enlarged in A’-D’ and E’-H’, respectively. In wild-type hearts, Isl+ pacemaker cells (blue arrowheads) co-expressed TCF-mCherry. In isl1-/- mutants, no TCF-mCherry expression was observed in the Isl1+ pacemaker cells (blue arrowheads). TCF-mCherry expression was also detected in the AV canal of wild type (D) and isl1-/- mutants (H) (arrows). Scale bars represent 50 μm. See also Figure 5—figure supplement 1. EXPRESSION / LABELING:
PHENOTYPE:
|

Wnt/β-catenin signaling regulates parasympathetic control of heart rate. (A) Experimental timeline. Embryos with the ubiquitous tg(TETRE:Mmu.Axin1-YFP)tud1 and cardiomyocyte-specific tg(myl7:TETAM2-2A-mCherry)ulm8 transgenes were incubated with doxycycline (25 μg/mL) plus dexamethasone (100 μM) to induce cardiomyocyte specific Axin1-YFP expression. Axin1-YFP was induced at different time points and the heart rate was measured at 3 dpf by high-speed video imaging and image analysis. (B) Atrial and corresponding ventricular kymographs from a representative mCherry-/YFP- sibling control and an embryo with Axin1-YFP overexpression (Axin1+). Note the shorter period per full heartbeat (indicated by white dotted lines) in the Axin1 expressing embryo. Movies are available as Figure 6—videos 1 and 2, respectively. (C) Result of heart rate analysis (ventricle and atrium) on sibling and Axin1+ embryos, showing a significant increase in heart rate in Axin1+ embryos. (D) Relative changes in heart rate measured at 3 dpf after induction of Axin1 expression at various time points. ∆heart rate was calculated by using the heart rates measured in the Axin1+ group and the control group using the following formula: (Axin1-YFP+ - mCherry-/YFP-) / (mCherry-/YFP-) x 100%. Induction of Axin1-YFP expression between 32 hpf and 56 hpf resulted in increased heart rates at 3 dpf. See also Figure 6—videos 1 and 2. n(control/Axin1+) 9/6 (12som); 20/15 (24hpf); 10/7 (28hpf); 18/16 (32hpf); 10/8 (36hpf); 30/21 (48hpf); 37/28 (52hpf); 27/23 (56hpf); 30/29 (72hpf). Column bar graph plotting mean with SEM. Atrial (green) and ventricular (blue) analysis (E–F) Heart rates at 3 dpf of control (mCherry-/YFP-) or Axin1-YFP+ embryos at baseline or after treatment with the parasympathetic agonist carbachol or the sympathetic agonist isoproterenol. Atrial (E) and ventricular (F) measurements. (left n = 27 (control), 26 (Axin+); right n = 20 (control), 14 (Axin+)) (G) Proposed model for Isl1/Wnt function in cardiac pacemaker cells. Isl1 is a central factor in pacemaker cell development. Isl1 expression is restricted to pacemaker cells in which it is required to establish the rhythmic cycle of membrane depolarizations and heart contractions and the activation of Wnt/β-catenin signaling. Wnt/β-catenin signaling is required to establish M2 cholinergic receptor signaling, which allows parasympathetic signals (e.g. acetylcholine) to adjust the rate of rhythmic membrane depolarizations and heart contractions. βAR, β-Adrenergic Receptor. Statistical significance (unpaired (D) and paired (E–F) t-test) *p<0.05; **p<0.01; ***p<0.001; ****p<0.0001. See also Figure 6—source data 1, Figure 6—figure supplement 1, Figure 6—figure supplement 2, Figure 6—figure supplement 3, Figure 6—video 1 and Figure 6—video 2. |

No neuronal innervation was detected in the 3 dpf heart. Confocal scans from whole mount embryos containing the tg(myl7-DsRed) (marking all cardiomyocytes) and the tg(Isl1:GFF;UAS:GFP) (reporting isl1 expression and marking pacemaker cells in green) and stained for acetylated tubulin (marking acetylated microtubules found in neurons and axons). Anterior is up and posterior is down. 3D reconstruction (A–D) and cross-sections (E–M). The skin immediately ventral to the heart is covered in axons. The Isl1-GFP-positive pacemaker cells (arrowhead) at the sinoatrial junction are not in direct contact with the acTubulin+ axons. |

M2 muscarinic receptor is expressed at the venous pole. (A–B) In situ hybridization for the muscarinic 2a cholinergic receptor (chrm2a) in wild-type embryos at 55 hpf (A) and 72hpf (B). (C) ISH for chrm2a at 72 hpf in Axin1-YFP+ embryo (Wnt inhibition started at 52 hpf). Arrowheads indicate expression at the venous pole. Gray dashed line: location of the heart; white dashed line: location of the eyes. Anterior up. Scale bars represent 50 μm. |