
- Title
-
Cell volume changes contribute to epithelial morphogenesis in zebrafish Kupffer's vesicle
- Authors
- Dasgupta, A., Merkel, M., Clark, M.J., Jacob, A.E., Dawson, J.E., Manning, M.L., Amack, J.D.
- Source
- Full text @ Elife

Mosaic labeling of KV cells. (A) A dorsal view of the tailbud in a live zebrafish embryo at the 8-somite stage (8 ss) of development. Kupffer’s vesicle (KV) is positioned at the end of the notochord. The inset shows GFP-labeled KV cells surrounding the fluid-filled KV lumen in a Tg(sox17:GFP-CAAX) transgenic embryo at 8 ss. This is the middle plane of the KV. Scale = 10 μm. (B) Schematic of cell shape changes during KV remodeling. KV-ant cells (blue) and KV-post cells (red) have similar shapes at 2 ss, but then undergo regional cell shape changes such that KV-ant cells are elongated and KV-post cells are wide and thin by 8 ss. These cell shape changes result in asymmetric positioning of motile cilia that generate fluid flows for left-right patterning. (C) Structure of the ubi:zebrabow and sox17:CreERT2 transgenes and the possible recombination outcomes of the ‘zebrabow’ transgene by Cre recombinase activity in KV cell lineages. (D) Time course of mosaic labeling of KV cells. Brief treatment of double transgenic Tg(sox17:CreERT2); Tg(ubi:Zebrabow) embryos with 4-OHT from the dome stage to the shield stage generates low levels of Cre activity that changes expression of default RFP to expression of YFP in a subset of KV cells. (E) Mosaic labeled YFP+ KV cells at the middle plane of KV at 8 ss. (F) 3D reconstructed KV cells (green) and KV lumen (magenta) at 8 ss. Scale = 10 μm. (G–H) Morphometric parameters of 3D rendered KV-ant (G) and KV-post (H) cells: length = axis spanning from apical to basal side of the cell, height = axis spanning from dorsal to ventral side of the cell, and width = axis connecting lateral sides of the cell. Scale = 5 μm. EXPRESSION / LABELING:
|
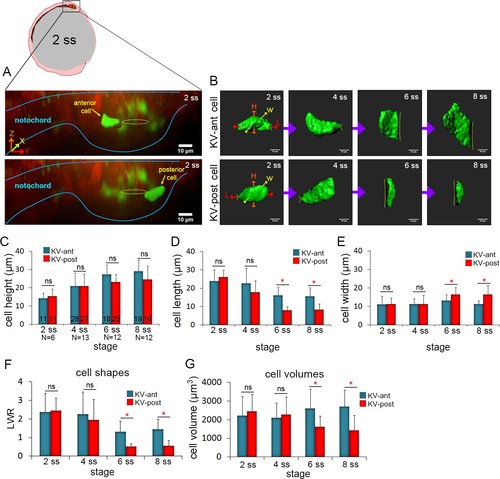
3D morphometric analysis of single cells reveals asymmetric cell volume changes during asymmetric KV cell shape changes. (A) A lateral view of a mosaic labeled KV in a Tg(sox17:CreERT2); Tg(ubi:Zebrabow) at 2 ss. The embryo diagram represents the orientation of the image. The notochord and KV are outlined in blue. Yellow lines mark the KV lumen. Examples of 3D reconstructed KV-ant and KV-post cells along the middle plane of KV are shown. Scale = 10 μm. (B) Representative snapshots of 3D rendered KV-ant and KV-post cells at different stages of KV development between 2 ss and 8 ss. The parameters including height (H), length (L) and width (W) were used to quantify cell morphology. Yellow lines indicate the KV luminal surface. Scale = 10 μm. (C–E) Quantification of height (C), length (D) and width (E) of individual KV-ant and KV-post cells during development. (F) A length-to-width ratio (LWR) was used to describe KV cell shapes. KV-ant and KV-post cells change shape between 4 ss and 6 ss. (G) Volume measurements of individual KV cells at different stages of development. Similar to cell shapes, KV-ant and KV-post cells change volume between 4 ss and 6 ss. All measurements presented in C-G were made on the same group of reconstructed cells. The number of KV-ant and KV-post cells analyzed is indicated in the graph in C. N = number of embryos analyzed at each stage. Graphs show the mean + SD. Results were pooled from three independent experiments. *p<0.01 and ns = not significant (p>5% with Welch’s T-Test). EXPRESSION / LABELING:
|

Single KV cells were sampled from all positions along the middle plane of KV for morphometric analysis. (A,B) Representative mosaic labeled KVs at pre (2 ss) and post-remodeling (8 ss) stages. YFP+ cells along the middle plane of the organ are numbered. KV lumen and cell boundaries are outlined. Yellow lines divide the KV lumen into anterior and posterior halves. (A’,B’) Pooled images of KV lumen boundaries and cell numbers show no bias in the distribution of mosaic labeled cells. Scale = 20 μm. |
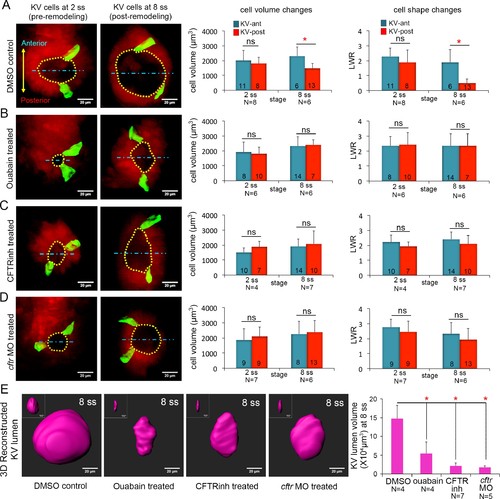
Ion channel activity mediates asymmetric KV cell volume changes, KV lumen expansion and KV cell shape changes. (A) 3D reconstructed KV-ant and KV-post cells in mosaic labeled Tg(sox17:CreERT2); Tg(ubi:Zebrabow) control embryos (treated with vehicle DMSO) showed asymmetric cell volume changes and asymmetric cell shape changes (length-to-width ratio) between 2 ss and 8 ss. (B) Inhibiting the Na+/K+-ATPase with ouabain treatments reduced KV lumen expansion and disrupted asymmetric cell volume changes. KV cells in ouabain treated embryos did not undergo asymmetric shape changes. (C–D) Interfering with Cftr function using the small molecule inhibitor CFTRinh-172 (C) or cftr MO (D) also blocked KV lumenogenesis and disrupted asymmetric cell volume changes and shape changes of KV cells. (E) Quantification of 3D reconstructed KV lumen volumes (insets depict lumen in YZ axis) in control and treated live embryos at 8 ss. For all quantitative analyses, the mean + SD is shown. The number of KV-ant and KV-post cells analyzed is indicated in the graphs in A-D. N = number of embryos analyzed. Results were pooled from two independent trials. Scale = 20 μm, *p<0.01 and ns = not significant (p>5% with Welch’s T-Test). EXPRESSION / LABELING:
PHENOTYPE:
|
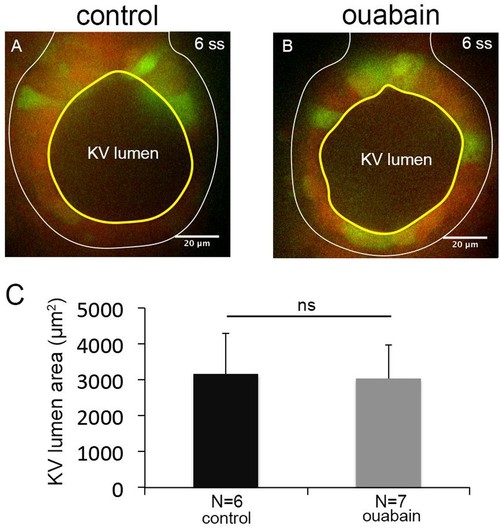
Ouabain treatments between 4–6 ss do not block KV lumen expansion. (A–B) Mosaic-labeled KV in a control embryo (A) and an embryo treated with ouabain from 4 to 6 ss (B). (C) Measurements of maximum KV lumen area indicated that ouabain treatments between 4–6 ss were not effective at blocking KV lumen expansion. N = number of embryos analyzed. Shown is the mean + SD. ns = not significant (p>5% with Welch’s T-Test). |

Vertex model simulations for cell shapes during KV remodeling. (A–D) Vertex model simulations with N = 10 KV-ant and KV-post cells. Upper and lower panels respectively show force-balanced states at 2 ss and 8 ss. All shown simulations start from the same initial cell positions, but the mechanical parameters differ. The full simulation box is cropped in order to focus on the KV. For the example of panel A, Figure 4—figure supplement 1B shows the respective full state. (A) Both KV and external cells are solid-like (interfacial tensions and ), and the lumen cross-sectional area expands according to experimental measurements between 2 and 8 ss. (B) KV cells are solid-like (
Your Input Welcome
Thank you for submitting comments. Your input has been emailed to ZFIN curators who may contact you if
additional information is required.
Oops. Something went wrong. Please try again later.
|