
- Title
-
Damage-induced reactive oxygen species regulate vimentin and dynamic collagen-based projections to mediate wound repair.
- Authors
- LeBert, D., Squirrell, J.M., Freisinger, C., Rindy, J., Golenberg, N., Frecentes, G., Gibson, A., Eliceiri, K.W., Huttenlocher, A.
- Source
- Full text @ Elife
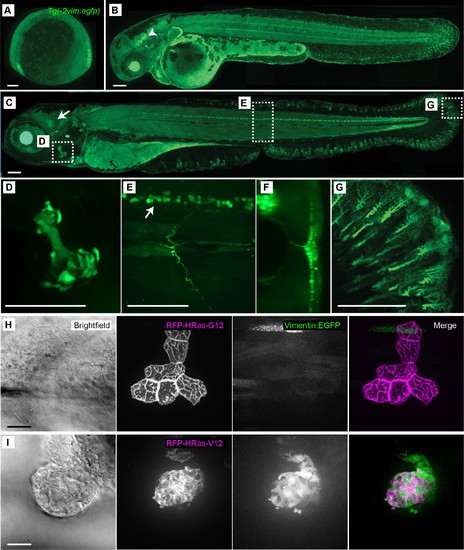
Characterization of the Tg(−2vim:egfp) zebrafish line. The Tg(−2vim:egfp) larvae express EGFP in cranial ganglion cells, spinal cord neurons, the opercle and fin fibroblasts. Images depict lateral views of Tg(−2vim:egfp) larvae with anterior to the left of (A) two somite stage, (B) 2 dpf, arrow indicating cranial ganglion cells, and (C) 4 dpf Tg(−2vim:egfp) larvae, arrow indicating EGFP positive cranial ganglion cells while boxes show regions used for subsequent zoomed images. (D) EGFP expression in the opercle. (E) and (F) spinal cord neuron expression, enface and cross section, respectively. (G) Mesenchymal cells of the caudal fin. (H) Mosaic RNA expression of HRasG12 in the Tg(−2vim:egfp) line did not induce vimentin promoter activation. (I) Mosaic RNA expression of oncogenic HRasV12 in the Tg(−2vim:egfp) line resulted in a dramatic increase in vimentin promoter activation, observed in two replicates. Scale bars represent 100 µm in A-G and 20 µm in H-I. EXPRESSION / LABELING:
|

A population of vimentin-positive cells with a rounded morphology developed at the wound edge and associate with areas of collagen misalignment. (A) Whole mount in situ hybridization for vimentin RNA in 4 dpf unwounded larvae. (B) Unwounded caudal fin and (C) 24 hpw caudal fin indicates increased vimentin expression following amputation, observed in two experiments. (D-G) Confocal microscopy of a live larval caudal fin showed that following amputation in the Tg(−2vim:egfp) line, in the wound region (box), a population of cells activated the vimentin promoter (arrow) by 26 hpw. (H,I) The activation of the vimentin promoter was regulated by ROS, as treatment with DPI reduced EGFP signal at the wound edge at 24 hpw as compared to control DMSO. (J) Ratio of the intensity of the vim:egfp expression at the central wound edge over background intensity of the fin in DPI and DMSO treated larvae at 24 hpw. (p=0.0282; n = 12 total fins over three replicates, with 2 to 6 fins per treatment per replicate; DMSO 95% CI = 1.18 to 1.33, DPI 95% CI = 1.07 to 1.21). (K) Spindle-shaped vim+ cells associate tightly with SHG fibers, as indicated by enface 3D reconstruction of SHG images of unwounded caudal fins in the Tg(−2vim:egfp) line. (L) End on view of a 3D surface rendered reconstruction of the association of vim+ cells and SHG fibers in unwounded caudal fins. (M) Spindle shaped vim+ cells associate with intact SHG fibers following amputation (Arrowhead), but a rounded vim+ cell population is observed in regions of collagen misalignment (Arrow) in the Tg(−2vim:egfp). (N) End on surface rendered reconstruction of the association of vim+ cells and SHG fibers in amputated caudal fins at 2 dpw, assessed in two replicates including 24 live larvae. Scale bar represents 100 µm in A-C, 50 µm in D-I, K and M and 30 µm in L and N. *p<0.05, error bars are standard deviation. EXPRESSION / LABELING:
PHENOTYPE:
|

Vimentin expression at the wound edge did not co-localize with epithelial or macrophage markers and was not influenced by leukocyte depletion. (A) In situ hybridization for vimentin at 24 hpw, showing anti-sense and sense labeling. (B) Vimentin-positive cells did not co-localize with krt4-positive cell populations at the wound edge at 24 hpw as visualized by confocal imaging of larvae by crossing the Tg(−2vim:egfp) and Tg(krt4:tdtom) lines. (C) 3-dimensional reconstructions of 3 time points from time-lapse recording (Figure 2—video 2) of wounded caudal fin from a Tg(−2vim:egfp) and Tg(krt4:tdtom) cross, showing both an enface view and a re-sliced end on view, with the re-slice indicated by arrowheads on enface view, of surface rendered three dimensional reconstructions for each time point, illustrating that gfp expression was not detected co-localizing with the tdTom expression. t = 0 is 12 hpw. (D) EGFP does not co-localize with a macrophage marker and (E) removal of leukocytes by morpholino knockdown of the pu.1 transcription factor did not inhibit the activation of the vimentin promoter at the wound edge at 24 hpw. (F,G) DUOX MO reduced EGFP signal at the wound edge at 24 hpw. (H, I) The activation of the vimentin promoter was regulated by NFκB as treatment with WA reduced EGFP signal at the wound edge at 24 hpw as compared to control DMSO. Scale bars in A, B, D, F and H represent 100 µm and 50 µm in C. EXPRESSION / LABELING:
PHENOTYPE:
|

Vimentin expression was required for proper wound healing. (A) Morpholino knockdown (MO1) of vimentin caused a significant wound healing defect in (B) regenerate area at 3 dpw (p<0.0001; n = 85 total larvae per treatment over four replicates, with 17 to 30 larvae per treatment per replicate; Ctl MO 95% CI = 94604.23 to 101336.98; vim MO 95% CI = 60550.63 to 67369.68). (C) Schematic of single-site CRISPR-Cas9 targeting of vimentin (top). Arrowhead indicates the presence of aberrant banding in the mosaic F0 mutant (bottom). Sequencing of the vim guide RNA target sites was also performed (see Materials and methods) on single embryos to further validate. (D) One example of sequencing results shows a 7 bp deletion in Exon 1, an early stop codon. (E) Amino acid alignment of vimentin from germline genomic DNA from adult F0 mosaic adults. (F) Mosaic F0 mutant larvae (Vim) displayed a significant defect in (G) regenerate area at 3 dpw (p<0.0001; ctl n = 130 larvae total, Vim n = 119 larvae total over 3 replicates with 36 to 45 larvae per treatment per replicate; ctrl 95% CI = 110643.20 to 115689.47, Vim 95% CI = 90275.48 to 95555.25). Scale bars in A and F represent 100 µm. Statistical significance: ****p<0.0001, error bars are standard deviation. PHENOTYPE:
|
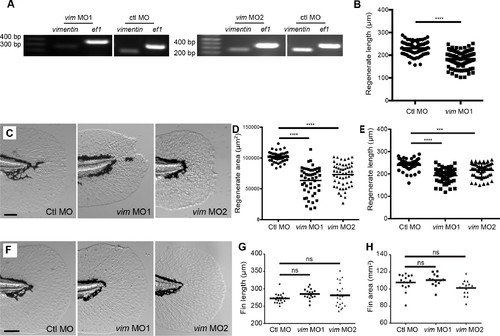
Vimentin depletion reduced vimentin expression but did not affect fin development. (A) RT-PCR of morpholino knockdown of vimentin with morpholino 1 and 2 (also see Materials and methods). (B) Morpholino knockdown of vimentin reduced regenerate length. (C-E) The defect in regenerate length and area was observed with either MO1 or MO2. (F-H) Morpholino knockdown of vimentin did not alter caudal fin area or length in unwounded larvae at 5 dpf. Regenerate area measurements for control morpholino and vim MO1 in D were also included in Figure 3B and length measurements for control morpholino and vim MO1 in E were also included in Figure 3—figure supplement 1B Data in G and H represent a single experiment performed in duplicate. For all other graphs, data was pooled from 2 or 4 replicate experiments. ***p<0.001, ****p<0.0001. PHENOTYPE:
|

Vimentin depletion did not affect vimentin promoter activation or apoptosis. (A) Maximum intensity confocal Z projections indicate that vimentin-deficient larvae activated the vimentin promoter normally in the Tg(−2vim:egfp) line at 1-, 2-, and 3 dpw. (B) Vimentin-deficient larvae did not display a defect in apoptosis at 1 hpw, as indicated by analysis of TUNEL staining. Scale bar represents 100 µm. |

Larval zebrafish regenerated the caudal fin following amputation and extended projections. (A) Time-lapse microscopy of caudal fin regeneration revealed the formation of epithelial projections by 24 hpw. Projections extending from the amputated plane are indicated with an arrow and arrowhead. (B, C) Morpholino knockdown of vimentin expression led to a significant reduction in the proportion of larvae forming projections at 24 hpw compared to control larvae (p=0.0348; n = 3 replicate percentages: for ctl MO 76 larvae total and for Vim MO 78 larvae total were scored over the three replicates, with 18 to 34 larvae per treatment per replicate; Ctl MO 95% CI = 66.13% to 88.54%; vim MO 95% CI = 7.56% to 65.78%). (D) Inhibition of early ROS signaling with DPI treatment also significantly reduced the proportion of larvae forming wound healing projections at 24 hpw (p=0.0129, n = 3 replicate percentages: for DMSO 72 larvae total and for DPI 66 larvae total were scored over the three replicates, with 11 to 26 larvae per treatment per replicate; DMSO 95% CI = 31.76% to 99.58%, DPI 95% CI = 8.79% to 41.87%). (E, F) Bright field microscopy of projections revealed the presence of fibrillar structures (box, black arrow). (G) Polarization microscopy was used to identify the fibers as organized structures, likely collagen, and by showing the cell membranes, confirmed that the fibers extended to the tip of the projections (white arrow). (H) The association of the fibers and overlying cells was further verified by combining SHG with phalloidin staining of actin. (I) 3D reconstruction surface rendering from time-lapse microscopy, collecting SHG and fluorescence signals in the Tg(krt4:egfp-caax) line, showed extending SHG fibers pushing the healing plane forward. Scale bars represent 100 µm in A and B,10 µm in E-H and 30 µm in I. *p<0.05, error bars are standard deviation. PHENOTYPE:
|

Pharmacological inhibition of early ROS and NFκB signaling disrupted the formation of SHG and epithelial projections. (A) Unwounded larvae rarely formed projections during development. (B) Representative bright field images of early ROS-inhibited and DMSO-control caudal fins at 24 hpw. (C) Early inhibition using WA significantly reduced projection formation at 24 hpw. (D, F, H) Polarization microscopy indicated a lack of projections in vimentin-deficient, ROS-inhibited, and WA treated larvae, respectively, at 24 hpw. (E, G, I) Z projections of SHG imaging and phalloidin labeling of the wound edge at 24 hpw in vimentin-deficient, ROS-inhibited, and WA treated larvae support the reduction of projection formation with these treatments. Data in A represents a single experiment and data in C represents data pooled from four replicates. Scale bars in A-D, F, and H represent 100 µm and E, G, and I represent 20 µm. *p<0.05. |

Extension of collagen fibers required vimentin. SHG microscopy showed the formation of SHG projections in (A) control, and that the projections were impaired in the (D) vimentin morphants. To quantify this observation, Z projections of the region posterior to the notochord, at 24 hpw, were used for analysis. (B, E) The contour of the wound edge was traced and measured, indicated by the blue line. To assess differences in fiber angle relative the wound edge of fibers, the SHG images were quantified using CurveAlign software, which identified fiber segments using curvelet transformation and calculated the angle of each of these segments, within 60 microns of the wound edge, relative to the nearest wound edge (see Methods for further details). The identified segments are illustrated in (C) (control) and (F) (vimentin morphant) as dots with small linear extensions, with green being the segments within 60 microns of the wound edge and included in the analysis, as shown in corresponding compass plot, in which the blue arrows indicate the number of segments at a given angle, with 90° being perpendicular and 0o being parallel to the wound edge. The red double arrow and corresponding red numeral indicate the mean angle of the fiber segments for that caudal fin. There was a decrease in (G) wound contour (reduced fiber extensions) in the vimentin morphants at 24 hpw compared to controls (p=0.0009; ctl MO n = 33 total larvae, vim MO n = 32 total larvae over 4 replicates with 7 to 9 larvae per treatment per replicate; ctrl MO 95% CI = 280.88 to 305.18, vim MO 95% CI = 250.32 to 275.1). (H) The fiber angle measurement indicated a significant decrease in orientation, with fibers exhibiting angles more parallel rather than perpendicular, to the wound edge, in the vimentin morphants at 24 hpw (p=0.0003; ctl MO n = 30 total larvae, vim MO n = 32 total larvae over 4 replicates with 6 to 9 larvae per treatment per replicate; ctl MO 95% CI = 66.12 to 71.36, vim MO 95% CI = 59.21 to 64.31). Scale bars represent 100 µm in A and D. ****p<0..0001, error bars are standard deviation. PHENOTYPE:
|

Extension of the SHG fibers after wounding was inhibited by DPI and withaferin A (WA) treatment. (A) Early ROS inhibition using DPI reduced SHG wound edge contour at 24 hpw. (B) Early inhibition with WA also reduced SHG fiber contour length at 24 hpw. Graphs represent data pooled from three replicates. Scale bars represent 100 µm. ****p<0.0001. |
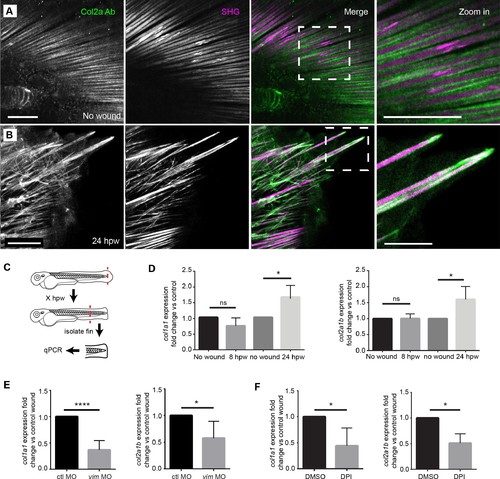
Projections contained both SHG fibers and Type II Collagen, and the expression of collagen at wounds was regulated by vimentin and ROS. (A) SHG and type II collagen fibers tightly associate in unwounded caudal fins and (B) within projections at 24 hpw as indicated by SHG imaging and immunofluorescence as observed in two experiments. (C) Schematic of col1a1 and col2a1b expression analysis from the caudal fin. (D) col1a1 and col2a1b expression increased in the wounded caudal fin by 24 hpw as assessed by qRT-PCR (col1a1 8 hpw p=0.0779, n = 5 replicates; 24 hpw p=0.0153, n = 6 replicates; col2a1b 8 hpw p=0.9491, n = 3 replicates, 24 hpw p=0.0294, n = 5 replicates). (E) Morpholino knockdown of vimentin expression reduced the expression of col1a1 and col2a1b in the wounded caudal fin compared to control (col1a1 p=0.004, n = 6 replicates; col2a1b p=0.0404, n = 5 replicates). (F) Early inhibition of ROS using DPI significantly reduced expression of col1a1 and col2a1b at 24 hpw (col1a1 p=0.0464, n = 4 replicates; col2a1b p=0.0126). *p<0.05. ****p<0.0001; error bars are standard deviation. EXPRESSION / LABELING:
PHENOTYPE:
|
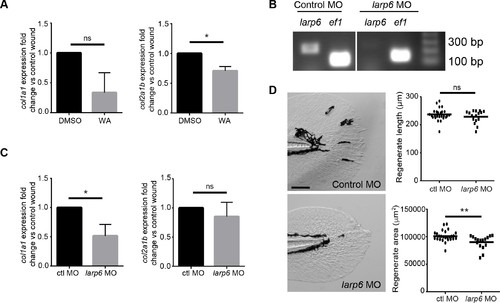
Larp6-deficient larvae displayed reduced wound induced collagen expression. (A) Early inhibition with WA led to reduced col1a1 and col2a1b expression at 24 hpw. (B) RT-PCR of larp6 knockdown via morpholino (see Materials and methods). (C) Larp6-deficient larvae displayed a reduction in col1a1 expression but no change in col2a1b expression at 24 hpw. (D) Larp6-deficient larvae exhibited a regenerate area defect at 2 dpw but not a regenerate length defect. Data in A and C represent data pooled from 4 replicate experiments and data in D represent a single experiment performed in triplicate. Scale bars represent 100 µm in D. *p<0.05, **p<0.01. EXPRESSION / LABELING:
PHENOTYPE:
|
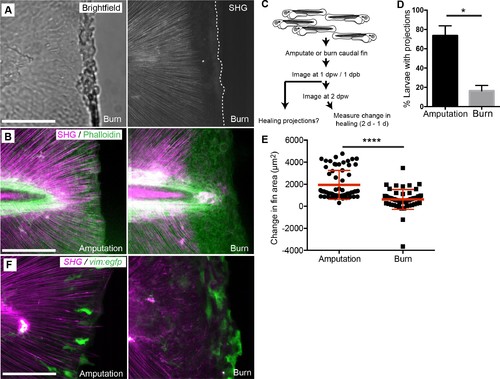
Burn wounding impaired the formation of epithelial and collagen projections and wound healing. (A) Burning of the caudal fin resulted in a striking absence of SHG fibers near the wound edge. (B) In contrast to the amputation assay, a large gap between the edge of the burned fin and the edge of the intact SHG fibers was observed at 24 hpw using a combination of SHG imaging and phalloidin staining, observed in two experiments. (C) Schematic of burn wound experiments and analysis. (D) Burn wounds displayed a significant reduction in epithelial projections at 24 hpw compared to transection wounds (p=0.0116; n = 3 replicate percentages: for amputation 108 larvae total and for burn 62 larvae total were scored over the three replicates, with 17 to 24 larvae per treatment per replicate; amputation 95% CI = 48.66% to 98.67%, burn 95% Ci = 2.21% to 30.46%). (E) Healing area was significantly reduced in the burn wounded larvae compared to amputated fins (p<0.0001, amputation n = 65 larvae, burn n = 58 larvae over three replicates, with 16 to 22 larvae per treatment per replicate; amputation 95% CI = 1750.47 to 2166.58, burn 95% CI = 497.69 to 939.76). (F) vim+ cells are present at the wound edge at 24 hpb, but the morphology is different compared to tail transection, as observed in two experiments. Scale bars represent 100 µm. *p<0.05, ****p<0.0001, error bars are standard deviation. EXPRESSION / LABELING:
PHENOTYPE:
|

Collagen disruption impaired regeneration following amputation of the caudal fin. (A) Inhibition of the collagen crosslinking enzyme lysyl oxidase with BAPN resulted in reduced (B) regenerate area and (C) regenerate length at 2 dpw. (D) SHG image analysis of BAPN treated larvae at 24 hpw revealed a change in both (E) wound contour length and (F) fiber mean angle. (G) The change in caudal fin length was less in burn treatment than tail transection as between 24 and 48 hr after injury. Data in B and C represent a single experiment performed in triplicate. Data in E, F, and G are pooled from three replicate experiments. Scale bars represent 100 µm. ****p<0.0001. |