
- Title
-
ARID5B as a critical downstream target of the TAL1 complex that activates the oncogenic transcriptional program and promotes T-cell leukemogenesis
- Authors
- Leong, W.Z., Tan, S.H., Ngoc, P.C.T., Amanda, S., Yam, A.W.Y., Liau, W.S., Gong, Z., Lawton, L.N., Tenen, D.G., Sanda, T.
- Source
- Full text @ Genes & Dev.
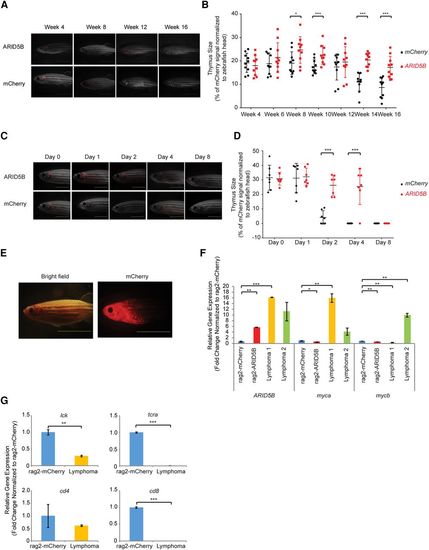
Overexpression of ARID5B leads to thymus retention, radioresistance, and the development of T-cell lymphoma in zebrafish. (A) Representative microscopy images of rag2-mCherry and rag2-ARID5B zebrafish at weeks 4, 8, 12, and 16. The merged fluorescent and bright-field images are shown. Bar, 5 mm. (B) Quantification of rag2-mCherry and rag2-ARID5B transgenic zebrafish thymus size at weeks 4, 6, 8, 10, 12, 14, and 16. The thymic area (indicated by the mCherry signal) was normalized to the size of the zebrafish head. Thymic involution was observed in the zebrafish at 3 mo after fertilization. (*) P < 0.05; (***) P < 0.001 by two-sample two-tailed t-test. (C) Representative microscopy images of rag2-mCherry (control) and rag2-ARID5B transgenic zebrafish after γ irradiation. The mCherry fluorescent signal was captured on day 0 (before γ irradiation) and days 1, 2, 4, and 8 (after γ irradiation). The merged fluorescent and bright-field images are shown. Bar, 5 mm. (D) Quantification of rag2-mCherry and rag2-ARID5B transgenic zebrafish thymus size after the fish were subjected to γ irradiation. The thymic area was normalized to the size of the zebrafish head. (***) P < 0.001 by two-sample two-tailed t-test. (E) Representative image of rag2-ARID5B transgenic zebrafish that developed a lymphoma phenotype. Bar, 10 mm. (F) mRNA expression of ARID5B, myca, and mycb in the thymic cells of rag2-mCherry (control) zebrafish, normal rag2-ARID5B zebrafish, and two rag2-ARID5B zebrafish with lymphoma was analyzed by qRT–PCR. The relative gene expression was normalized to that of ef1a (internal control). The data represent the mean ± SD of duplicate samples. (*) P < 0.05; (**) P < 0.01; (***) P < 0.001 by two-sample two-tailed t-test. (G) mRNA expression levels of lck, t-cell receptor α (tcra), cd4, and cd8 in the thymic cells of rag2-mCherry (control) zebrafish and rag2-ARID5B zebrafish with lymphoma were analyzed by qRT–PCR. The relative gene expression was normalized to that of ef1a (internal control). The data represent the mean ± SD of duplicate samples. (**) P < 0.01; (***) P < 0.001 by two-sample two-tailed t-test. EXPRESSION / LABELING:
PHENOTYPE:
|