
- Title
-
Neurotransmitter-mediated activity spatially controls neuronal migration in the zebrafish cerebellum
- Authors
- Theisen, U., Hennig, C., Ring, T., Schnabel, R., Köster, R.W.
- Source
- Full text @ PLoS Biol.

THNs migratory route and associated morphological changes. (A) Anatomical overview of atoh1a:KalTA/4xUAS-GFP-expressing larvae from 30 hpf. Prominent features are indicated in transmitted-light images (top panel). Scale bar: 100 μm. For further details about THN position in adults, refer to [29]. (B) THNs are identified in the lower panel by their fluorescence and position in the cerebellum between URL and MHB, as well as their expression of GFP from an atoh1a promoter. Over time, cells migrate towards the MHB, which they follow ventrally to form a large cluster. Blue arrowheads and stars indicate start position, yellow arrowheads migrating THNs, yellow arrows point to the emerging THN cluster at the ventral end of the MHB. Anatomical features are indicated in the transmitted light images in the top row. Scale bar: 100 μm. See also S1 Video. (C) Morphologically, THNs begin their migration as very elongated cells that remain in contact with the URL until the main cell body has reached the MHB (arrows; top panel). At the MHB, dorsal cells exhibit a poorly polarized stage with many protrusions (arrowhead). Cells positioned more ventrally at the MHB assume a unipolar morphology with the protrusion extending ventrally (arrows). THNs transiently express PM-targeted YFP. Elapsed time is indicated at the top. Scale bar: 20 μm. Colored frames indicate the cells shown in (C). See also S2 Video. (D) Higher magnification of THNs indicated in (B), illustrating the morphological changes of THNs along their migratory route. Scale bar: 10 μm. (E) Schematic representation of THN morphology in different phases of migration. atoh1a; atonal 1a; GFP, green fluorescent protein; hpf, hours post fertilization; LRL, lower rhombic lip; MHB, midbrain-hindbrain boundary; PM, plasma membrane; THNs, tegmental hindbrain nuclei neurons; UAS, upstream activating sequence; URL, upper rhombic lip; YFP, yellow fluorescent protein. |

Calcium signals indicate the presence of activity in the cerebellum. (A) As THNs differentiate along route, only THNs in phase 2 show expression of H2B-GCaMP6s from the elavl3 promoter, which increases in strength towards the ventral end of the MHB. Numbers identify the nuclei shown as examples in this figure. Scale bar: 20 μm. (B) Stills from the fluorescence recording of nucleus 12 shown in (B), top panel, demonstrate the presence of calcium transients. In the lower panel, a ratiometric image comparing subsequent frames of the sequence in the top panel is given. White indicates high-intensity divergence and blue indicates low-intensity divergence. Scale bar: 3 μm. (C) Fluorescence intensity measurement F of nucleus 12 for the whole observation time is shown in black and the calculated local baseline F0 in red. (D) Converting these into F/F0 shows that nucleus 12 exhibited only one prominent calcium event with smaller amplitudes difficult to judge due to the presence of noise. (E) After application of a bandpass filter, noise and false-positive signals are removed from the trace, whereas actual signals become more prominent. (F) Different patterns of calcium transients are shown for several nuclei imaged simultaneously. Nucleus 4 exhibits a single event like nucleus 12, whereas nucleus 7 is silent during the observation time. Nucleus 14 represents very regular calcium oscillations that were observed in a fraction of nuclei, whereas nucleus 9 appears to be a mixture of several types. (G) Plotting maximal amplitude values for each signal demonstrates that a wide range of signal strengths can be detected in THNs. (H) Fourier transformation analysis of the various traces illustrates that some nuclei have very regular signals at a distinct frequency (bottom), whereas others with a low incidence of calcium events do not show this preference (top). For control, results were compared for filtered (red) and unfiltered (black) traces. (I) All 195 FFTs were analyzed for the most prominent frequency by plotting the frequency corresponding to the maximal amplitude value. Although this represents the range of frequencies contained in the dataset, the frequency of regular oscillations can be obscured by the inclusion of other signal patterns. Hence, 32 nuclei with strong regular calcium oscillations were selected and their oscillation frequency determined by Gaussian fits. The frequencies of these oscillations are centered around a mean value of 14.1 mHz. (J) Calcium signals are detected in THNs throughout the cerebellum. The positions of THNs transiently expressing PM-bound GCaMP6s and exhibiting at least one signal during the observation period of 30 min were superimposed to create a map (N = 50). Scale bar: 10 μm. (K) Example of a THN exhibiting localized calcium signals, showing the position of the cell in the tissue. Scale bar: 20 μm. (L) Stills from the recording of THNs indicated in (K). Ratiometric images comparing the fluorescence of GCaMP6s in subsequent stills relative to the frame with the highest signal are shown (white indicates high, blue low signal difference). Arrow points to the calcium signal. Elapsed time relative to the frame with the highest GCaMP6s signal is indicated on the images. Scale bar: 10 μm. See also S3 Video. Data depicted in the graphs can be accessed in S1 Data. F/F0, fluorescence over background; FFT, fast Fourier transform; flour, fluorescent; freq, frequency; GCaMP6, genetically encoded calcium sensor, circular permutated green florescent protein-Calmodulin-M13 peptide 6; H2B, Histone 2B; MHB, midbrain-hindbrain boundary; oscill, oscillation; PM, plasma membrane; THN, tegmental hindbrain nuclei neuron, URL, upper rhombic lip. |

Optogenetic activity control influences THN migration. (A) Overlay of fluorescent and transmitted-light images of a 30 hpf embryo co-expressing H2B-GCaMP6s and ChR2-YFP. At this developmental stage, only nuclei at the ventral end of the MHB express H2B-GCaMP6s at high enough levels to detect fluorescence signal increases over the background fluorescence from ChR2-YFP (nuclei 1 and 2, compare to nucleus 3 in the central region of the MHB). Nuclei at the URL, however, express only ChR2-YFP and serve as negative control (nucleus 4). Scale bar: 25 μm. (B) Nuclei co-expressing both markers show highly regular calcium transients (nuclei 1 and 2), while negative control THNs do not (nuclei 3 and 4). (C) Fourier transformation reveals that the frequency of calcium transients in nuclei 1 and 2 strongly coincides with the expected frequency of one signal per min, or 16.7 mHz (arrows). Nucleus 3 shows a weak peak at this frequency. (D) Tracking of THNs expressing either control (YFP-CAAX), ChR2-YFP, or SwiChR-YFP along the MHB (colored dots) demonstrates that hyperpolarization slows THNs down, while depolarization increases speed. Transmitted light images on the left provide positional information on THNs within the tissue; boxes indicate the region shown at greater magnification in the fluorescence images. Migration progress over time is schematically indicated on the right, in which arrows indicate the start and end points for the shown frames. Elapsed time is indicated at the top. Scale bar: 25 μm. See also S4 Video. (E) Individual THNs (orange) were tracked in SIMI°BioCell software for quantification. An example is marked in dark blue. The tracks were corrected for tissue shifts using reference points (cyan). See also S5 Video. (F) THNs reduce their migration speed as they progress along the MHB from approximately 25% to −35% of the distance to the ventral end. Zero percent is the dorsal and 100% is the ventral end of the MHB. Track distribution is given at the top. (G) Migration speeds are affected by de- and hyperpolarization irrespective of starting point. Means ± SEM are plotted per 10% MHB bin. (H) Tracks were grouped as either dorsal (≤ −27.5% MHB) or ventral (≥27.5% MHB) to test the significance of de- and hyperpolarization compared to control level. Only significant differences are indicated. Data depicted in the graphs can be accessed in S2 Data. CAAX, PM-targeting signal derived from K-Ras; ChR2, channelrhodopsin; F/F0, fluorescence over background; GCaMP6, circular permutated green florescent protein-Calmodulin-M13 peptide 6s; H2B, Histone 2B; hpf, hours post fertilization; MHB, midbrain-hindbrain boundary; n.s., not significant; PM, plasma membrane; SwiChR, mutated channelrhodopsin; THN, tegmental hindbrain nuclei neuron; URL, upper rhombic lip; YFP, yellow fluorescent protein. |
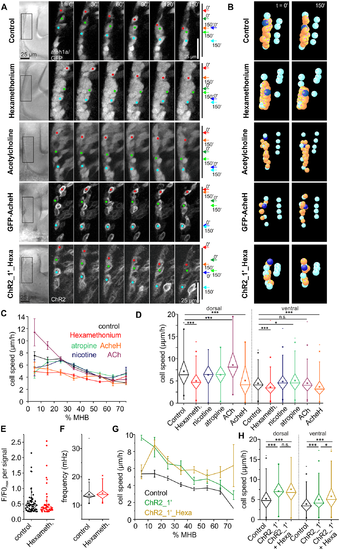
ACh promotes THN migration. (A) Tracking THNs in the atoh1a:KalTA/4xUAS-GFP fish line shows a migration decrease upon ACh receptor block, whereas stimulating THNs with excess ACh increases the migration speed in the dorsal portion of the MHB. Overexpressing AcheH mimics the effect of hexamethonium, whereas optogenetic depolarization rescues the hexamethonium speed decrease. THN progress over time is schematically indicated on the right. Elapsed time is indicated at the top. Scale bar: 25 μm. See also S7 Video. (B) Individual tracks (orange and dark blue) after shift correction (cyan) illustrate these effects. See also S8 Video. (C) Hexamethonium and AcheH overexpression slow cells down regardless of their starting point, whereas ACh has a stimulatory effect only in the dorsal region of the MHB. Neither atropine nor nicotine produce prominent effects. Means ± SEM are plotted per 10% MHB bin. (D) Dorsal (≤25% MHB) and ventral tracks (≥32.5% MHB) are similarly affected by hexamethonium or AcheH, whereas Atropine induces a slight speed increase only in ventral tracks. ACh increases speed in dorsally migrating THNs. Significance levels were calculated to control, and only significant differences are indicated. (E) Maximum values for each signal amplitude of F/F0 traces was plotted to illustrate that hexamethonium tends to dampen signal strength. Note that the difference to control is not statistically significant, due to the low N of signals. (F) The frequency spectrum contained in the FFT does not change upon hexamethonium treatment. (G) THN speed values along the MHB in ChR2-activating conditions are very similar regardless of hexamethonium treatment. Means ± SEM are plotted per 10% MHB bin. (H) Statistical analysis confirms that hexamethonium treatment does not change the ChR2 effect. Bars are means ± SEM. Data depicted in the graphs can be accessed in S1, S2 and S3 Data. ACh, acetylcholine; AcheH, Ache glycosylphosphatidylinositol-anchored isoform H; atoh1a; atonal 1a; ChR2, channelrhodopsin; FFT, fast Fourier transform; F/F0, fluorescence over background; GFP, green fluorescent protein; Hexameth, hexamethonium; MHB, midbrain-hindbrain boundary; n.s., not significant; THN, tegmental hindbrain nuclei neuron. |

Glycine negatively influences THN migration. (A) Single cell tracking along the MHB shows that glycine as well as overexpression of a glycine receptor subunit slows THNs down. For control, a point mutation was introduced in the GlyRa1 subunit that abolishes ligand binding (Y226F). Their progress is schematically indicated on the right. Elapsed time is indicated at the top. Scale bar: 25 μm. See also S9 Video. (B) Glycine-treated THNs, as well as GlyRa1 wt or Y226F overexpressing THNs (orange, dark blue), were tracked in SIMI°BioCell software. References for correction are shown in cyan. See also S10 Video. (C) Glycine effects are strongest in the central region of the MHB. For control, embryos were treated with glycine together with MK801 or strychnine. Control values from experiment shown in Fig 4C. Means ± SEM are plotted per 10% MHB bin. (D) Statistic analysis confirms that the effects on THN migration speeds induced by glycine occur in the central region of the MHB and depend on the glycine receptor; control values from experiment shown in Fig 4D. (E) Calcium transient rates decrease in THNs upon exposure to glycine, but their strength does not differ from controls. Maximal F/F0 values from each transient are compared to controls from Fig 2G, and are statistically not significant. (F) FFTs contain frequencies of a similar spectrum compared to controls from Fig 2I. (G) Overexpression of the wt GlyRa1 subunit mimics the effects of excess glycine without adding extracellular glycine. When substrate binding is abolished (Y226F), THNs migrate similar to untreated control cells. Control values from experiment shown in Fig 4C and 4D. Means ± SEM are plotted per 10% MHB bin. (H) The hyperpolarizing effect of glycine depends on the co-expression of the channel KCC2. This gene is very weakly expressed in developing neurons as reported previously [45,46], but could be observed in the spinal cord and the hindbrain of a 30 hpf wt embryo (top panel, bottom panel: sense probe for control). Boxes indicate regions shown in (G). Scale bar: 200 μm. (I) Magnification of region indicated in (F) to show that KCC2 may be present at the MHB and the ventral region of the rostral hindbrain at 30 hpf, although its expression is weak. Scale bar: 50 μm. See also S5 Fig. Data depicted in the graphs can be accessed in S1 and S3 Data. F/F0, fluorescence over background; FFT, fast Fourier transform; GFP, green fluorescent protein; Gly, glycine; GlyRa1, glycine receptor alpha1 subunit; hpf, hours post fertilization; KCC2, solute carrier family 12 (potassium/chloride transporter), member 5b; MHB, midbrain-hindbrain boundary; MK801, dizocilpine; n.s., not significant; PM, plasma membrane; Stry, strychnine, THN, tegmental hindbrain nuclei neuron; URL, upper rhombic lip; wt, wild-type; Y226F, glycine receptor alpha1 subunit Y226 mutated to F. |

Glutamate negatively influences THN migration. (A) Following THNs along the MHB suggested a cell speed increase upon AMPA receptor block, whereas NMDA causes a speed decrease. CNQX and hexamethonium applied simultaneously produced no speed change in ventral tracks. Progress over time is indicated. Elapsed time is given at the top. Scale bar: 25 μm. See also S11 and S13 Videos. (B) Individual tracks (orange, dark blue) are represented after tracking and correction (cyan markers) in SIMI°BioCell. See also S12 and S14 Videos. (C) Migration speed analysis shows that blocking AMPA receptors increases speeds strongly in the ventral part of the MHB. NMDA produces the opposite effect again in the ventral region. Blocking AMPA and nicotinic ACh receptors simultaneously leads to an increase in THN speed in dorsal tracks, whereas in the ventral part, the effects outbalance each other. Control values from experiment shown in Figs 4D and 6C. Means ± SEM are plotted per 10% MHB bin. (D) Statistic analysis confirms that the effects on THN speeds by the glutamate system are confined mostly to the ventral part of the MHB; control values from experiment shown in Fig 4E. Bars are means ± SEM. Data depicted in the graphs can be accessed in S3 Data. ACh, acetylcholine; AMPA, α-amino-3-hydroxy-5-methyl-4-isoxazolepropionic acid receptor; CNQX, 6-cyano-7-nitroquinoxaline-2,3-dione; Hexam, hexamethonium; MHB, midbrain-hindbrain boundary; MK801, dizocilpine; NMDA, N-methyl-D-aspartate; THN, tegmental hindbrain nuclei neuron. |
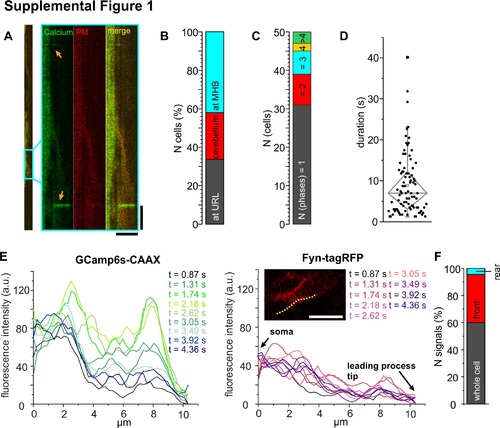
(A) Left: Full kymograph of the GCaMP6s-CAAX recording from the example THN shown in Fig 2J. Box indicates the region magnified on the right. Calcium transients are indicated by arrows. Vertical scale bar: 20 s, horizontal: 10 μm. (B) Signaling THNs were assigned to three regions in the cerebellum, but no regional preference for calcium transients was detected. (C) Low calcium frequencies detected with the PM-bound calcium sensor match results obtained from elavl3:H2B-GCaMP6s embryos. (D) Calcium transients show great variability in their duration. (E) Maximum signal intensity of GCamp6s from the example THN in (A) plotted by frame. Fyn-tagRFP-T fluorescence intensity remains similar over time, fluorescence increases in GCamp6s therefore are not due to position shifts. Intensities were measured along a line indicated in image. Intensity values were averaged over 5 neighboring points. (F) In about one third of all THNs, calcium transients occur at the front. CAAX, PM-targeting signal derived from K-Ras; GCaMP6, circular permutated green florescent protein-Calmodulin-M13 peptide 6; PM, plasma membrane; THN, tegmental hindbrain nuclei neuron. |

(A) Overview of the cerebellum of a Tg(elavl3:Hsa.H2B-GCaMP6s) embryo expressing SwiChR-YFP. Box indicates the nuclei whose calcium traces are given in (B). Anatomical features are indicated. Scale bar: 25 μm. (B) Example calcium F/F0 traces of SwiChR-expressing Tg(elavl3:Hsa.H2B-GCaMP6s) embryos. Note that the bottom trace was obtained from a cell that expressed only H2B-GCaMP6s and serves as negative control. Fourier transformed traces of the same examples are given on the right. None of the traces show a peak except for frequencies in the range of the endogenous oscillations. The blue light illumination of SwiChR would correspond to a 1.67 mHz frequency (5 nuclei expressed both markers in 2 embryos). (C) Overview of the cerebellum of a Tg(atoh1a:KalTA) embryo co-expressing NLS-GCaMP6s/H2B-tagRFP and ChR2-YFP. Box indicates the nucleus whose calcium traces are given in (D) and (E) as nucleus 1. Anatomical features are indicated. Scale bar: 25 μm. (D) Examples of calcium F/F0 traces of ChR2 or SwiChR-positive THNs co-expressing NLS-GCaMP6s. Only the nuclei with ChR2 show strong regular peaks (arrows; 9 nuclei out of 36 measured including controls from 9 embryos). In SwiChR, occasionally some nuclei respond to endogenous signals (top). These events are too rare to be noted in the Fourier transformation (see (E); 13 nuclei from 13 embryos expressed both markers). Note that the bottom trace in SwiChR is derived from a cell that expressed only NLS-GCaMP6s, but no SwiChR, and serves as negative control. (E) Fourier transformed traces of the examples given in (D). Nucleus 1 of the ChR2 traces shows a clear peak at the expected frequency of 16.7 mHz. SwiChR-derived traces do not show such a peak except for frequencies in the range of the endogenous oscillations. The blue light illumination of SwiChR would correspond to a 1.67 mHz frequency. (F) Example traces from Tg(elavl3:Hsa.H2B-GCaMP6s) embryos treated with hexamethonium demonstrate that calcium signal amplitudes are decreased (left). FFTs of these traces are given on the right. (G) Example traces from Tg(elavl3:Hsa.H2B-GCaMP6s) embryos treated with glycine demonstrate that calcium signal amplitudes are not affected by the hyperpolarizing agent (left). Note that these examples are chosen from the minority of nuclei that still exhibited calcium transients. FFTs of these traces are given on the right. ChR2, channelrhodopsin; F/F0, fluorescence over background; FFT, fast Fourier transform; GCaMP6, circular permutated green florescent protein-Calmodulin-M13 peptide 6; H2B, Histone 2B; NLS, nuclear localization sequence; SwiChR, mutated channelrhodopsin; YFP, yellow fluorescent protein. |
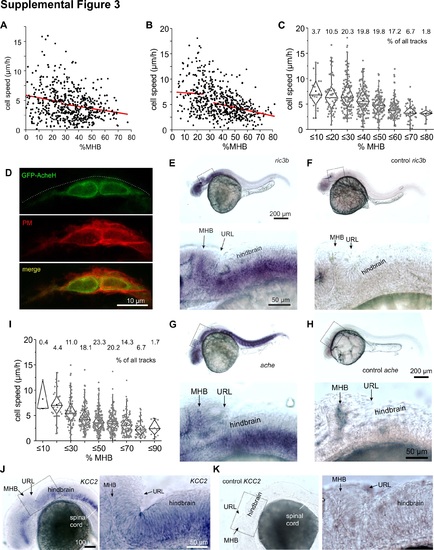
(A) Speeds from control THNs expressing YFP-CAAX migrating under the same illumination conditions as used in the optogenetic experiments are given as individual dots. Red lines represent the regression lines based on all values below or over the cutoff point 27.5% MHB. (B) Speeds from control THNs expressing GFP treated with 1% DMSO are given as individual dots. Red lines represent the regression lines based on all values below 25% MHB or over the 32.5% MHB. (C) THNs migrating under control conditions (1% DMSO) slow down from 25%–35% MHB as they progress ventrally. Track distribution is indicated at the top. (D) At high resolution, GFP-AcheH (top panel) appears to be present inside THNs as well as at the PM (middle). The overall morphology of these early phase 2 THNs appears unaffected. Scale bar: 10 μm. (E) WISH of a 30 hpf wt embryo stained for ric3b expression. This chaperone for nicotinic ACh receptors shows a strong expression in the brain. Box indicates the region magnified in the lower panel. Prominent anatomical features are indicated. Scale bars: 200 μm/50 μm. (F) Sense probe against ric3b is used as control for the staining shown in Figure S3E. Box indicates the region magnified in the lower panel. Major anatomical features are indicated. Scale bars: 200 μm, 50 μm. (G) WISH against ache shows strong staining in the muscles, the ventral hindbrain and a weaker staining in the cerebellum. This is more clearly seen in the magnified region in the second image. Anatomical features are annotated. Scale bars: 200 μm/50 μm. (H) As control, the sense probe against ache was used. Major anatomical features are indicated. Boxes indicate the magnified regions. Scale bars: 200 μm/50 μm. (I) Plots of every track in the glycine dataset along the MHB do not indicate the presence of subpopulations of THN cells with differential responses to glycine. The overall distribution of the tracks is indicated at the top. (J) Kcc2 (slc12a5b) is weakly expressed in the cerebellum at 30 hpf. Stronger staining can be observed in the ventral hindbrain and the spinal cord; image on the right is magnified region indicated in the left image. Prominent anatomical features are indicated. Scale bars: 100 μm/ 50 μm. (K) Sense probe was used as control for WISH against kcc2 (slc12a5b); image on the right is magnified region indicated in the left image. Prominent anatomical features are indicated. Scale bars: 100 μm/ 50 μm. Data depicted in the graphs can be accessed on the PLOS Biology Supplemental Information webpage (S2 and S3 Data). ACh, acetylcholine; AcheH, Ache GPI-anchored isoform H; CAAX, PM-targeting signal derived from K-Ras; DMSO, dimethyl sulfoxide; GFP, green fluorescent protein; hpf, hours post fertilization; MHB, midbrain-hindbrain boundary; PM, plasma membrane; THN, tegmental hindbrain nuclei neuron; WISH, whole mount in situ hybridization; YFP, yellow fluorescent protein. |
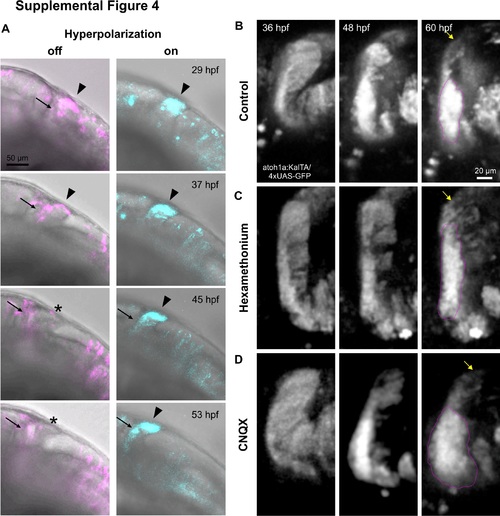
(A) Fluorescent images are overlaid on transmitted light images to show tissue development and delayed THN migration progress in prolonged hyperpolarization. Arrowheads indicate the starting points, arrows point to the THNs’ progress. Stars indicate the original starting point after THNs have left the region. Developmental stages are indicated. Scale bar: 100 μm. See also S6 Video. (B) Magnified cerebellar region from images of control THNs shown in Fig 1B. THNs emerge from the URL, then follow the MHB to form a cluster at the ventral end of the MHB, indicated by magenta line. Yellow arrow indicates the dorsal end of the cerebellum to facilitate the localization of THNs in the tissue. Developmental stages are indicated at the top. Scale bar: 20 μm. (C) Prolonged hexamethonium treatment leads to a delay in THN cluster formation as seen by the elongated distribution of THNs instead of a cluster (magenta outline). The arrow indicates the dorsal end of the cerebellum and THNs that are still distributed along the MHB. See also S15 Video. (D) Blocking AMPA receptors continuously with CNQX leads to premature aggregation of THNs near the ventral region of the cerebellum. Note the size and shape of the cluster at 60 hpf (outlined in magenta) compared to control in (B). Arrow denotes the dorsal end of the tissue. AMPA, α-amino-3-hydroxy-5-methyl-4-isoxazolepropionic acid receptor; CNQX, 6-cyano-7-nitroquinoxaline-2,3-dione; MHB, midbrain-hindbrain boundary; THN, tegmental hindbrain nuclei neuron; URL, upper rhombic lip. |
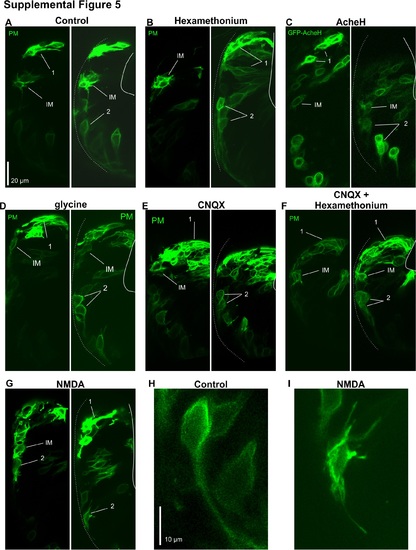
(A) Control THNs treated with 1% DMSO exhibit the typical morphology of the different phases of migration. THNs expressed YFP-CAAX and are indicated by arrows and their migratory stage. Dotted line represents MHB, white line represents URL. Scale bar: 20 μm. (B) Hexamethonium does not change THN morphology, neither does the overexpression of GFP-AcheH (C). (D) Activating the glycine neurotransmitter system does not change THN morphology. (E) Neither CNQX nor (F) CNQX and hexamethonium treatment affect THN morphology (left and right panels). Adding NMDA (G), however, led to increased protrusions in ventrally located THNs (middle panel, compare to controls in Fig 4F). (H), (I) Magnification of THNs identified by “2” in (A) and (G) demonstrates the different morphologies in control (H) and excess NMDA (I) conditions Scale bar: 10 μm. CAAX, plasma membrane-targeting signal derived from K-Ras; CNQX, 6-cyano-7-nitroquinoxaline-2,3-dione; DMSO, dimethyl sulfoxide; MHB, midbrain-hindbrain boundary; NMDA, N-methyl-D-aspartate; THN, tegmental hindbrain nuclei neuron; URL, upper rhombic lip; YFP, yellow fluorescent protein. |