
- Title
-
Cell-type heterogeneity in the early zebrafish olfactory epithelium is generated from progenitors within preplacodal ectoderm
- Authors
- Aguillon, R., Batut, J., Subramanian, A., Madelaine, R., Dufourcq, P., Schilling, T.F., Blader, P.
- Source
- Full text @ Elife
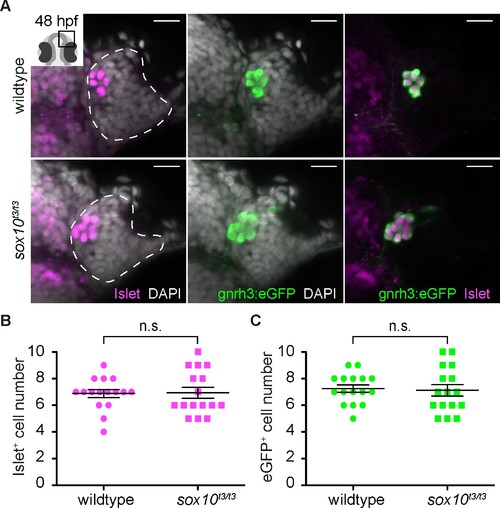
Islet1/2 labels Gnrh3 neurons of the olfactory epithelium and its expression is unaffected in sox10 mutants. (A) Single confocal sections of olfactory epithelia from Tg(gnrh3:eGFP) embryos at 48 hpf, in either wildtype or sox10t3/t3 mutants, labelled for the expression of Islet1/2 (magenta) and eGFP (green); nuclei are labelled with DAPI (grey). Embryos are viewed dorsally and the inset in the first panel shows a schematic representation of a 48 hpf embryonic head indicating the region analysed. Dotted lines highlight the olfactory epithelia and scalebars represent 15 μm. (B) Counts of cells expressing Islet1/2 in either wildtype or sox10t3/t3 mutant epithelia (6.8 ± 0.3 versus 6.9 ± 0.4 cells per epithelium, n = 16 epithelia). (C) Counts of cells expressing eGFP from the Tg(gnrh3:eGFP) transgene in either wildtype or sox10t3/t3 mutant placodes (7.2 ± 0.3 versus 7.1 ± 0.4 cells per epithelium, n = 16 epithelia). (B–C) Mean ±s.e.m. P values are calculated using a two-tailed Student's t-test, n.s. not significant. |
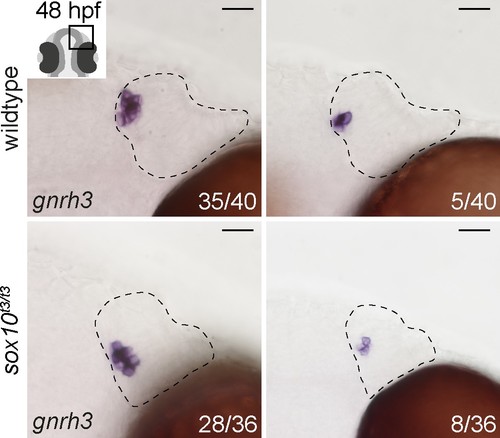
Expression of endogenous gnrh3 in sox10t3/t3 mutants and wildtype siblings. Representative bright-field images of in situ hybridisation against endogenous gnrh3 transcripts in wildtype or sox10t3/t3 mutant olfactory epithelia showing high and low numbers of expressing cells. The number of epithelia binned for each category over the total number of epithelia analysed is indicated. Dotted lines highlight the olfactory epithelia and scalebars represent 20 μm. |
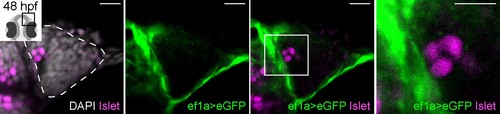
Cre/lox lineage mapping of neural crest cells reveals contributions to cells surrounding the olfactory epithelium but not to Islet/Gnrh3+ neurons. Single confocal sections of an olfactory epithelium from a double-heterozygous Tg(−28.5Sox10:Cre);Tg(ef1a:loxP-DsRed-loxP-egfp) embryo at 48 hpf, labelled for the expression of Islet1/2 (magenta) and eGFP (green); nuclei are labelled with DAPI (grey). No eGFP;Islet1/2 double-positive cells are detected in the epithelia. Embryos are viewed dorsally and the inset in the first panel shows a schematic representation of a 48 hpf embryonic head indicating the orientation of the region analysed. The dotted line highlights the olfactory epithelium and scalebars represent 15 μm in the low and 10 μm in the high magnifications, respectively; the region shown in the high magnification is indicated in the neighbouring panel. |
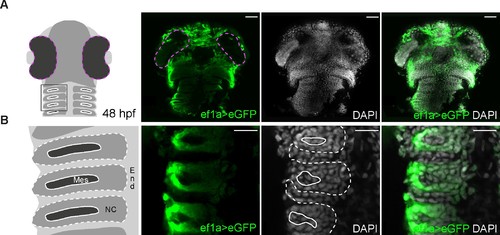
Expression of eGFP is detected throughout the head after switching of the loxP-DsRed-loxP-egfp cassette, including in known neural crest-derived lineages. (A) Low magnification images of the entire head of a double-heterozygous Tg(−28.5Sox10:Cre);Tg(ef1a:loxP-DsRed-loxP-egfp) embryo at 48 hpf labelled for eGFP (green); nuclei are labelled with DAPI (grey). The first panel shows a schematic representation of a 48 hpf embryonic head indicating the region seen in (B). eGFP is detected throughout the head. Scalebars represent 50 μm. (B) High magnification images of the embryo shown in (A). The first panel shows a schematic representation of three pharyngeal arches indicating the endodermal (End), mesodermal (Mes) and neural crest (NC) contributions. eGFP is detected specifically in the neural crest-derived contribution. Scalebars represent 20 μm. |
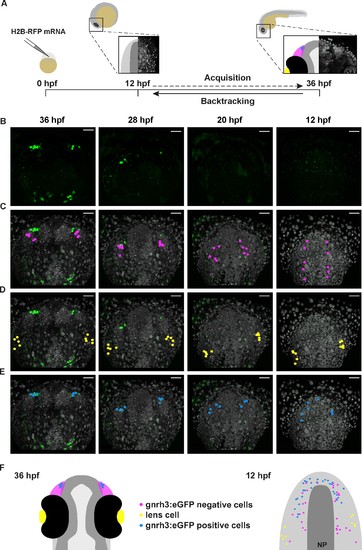
Lineage reconstruction reveals an anterior preplacodal ectoderm origin for Gnrh3 neurons: backtracking. (A) Schematic representation of the backtracking strategy. Synthetic mRNAs encoding Histone2B-RFP (H2B-RFP) were injected into Tg(gnrh3:eGFP) transgenic embryos, which were subsequently imaged from 12 to 36 hpf. The lineages of various populations of cells were manually retraced by backtracking H2B-RFP+ nuclei to their position at the beginning of the time-lapse series. (B–E) Confocal projections from a representative 4D dataset at 36, 28, 20 and 12 hpf showing the GFP channel alone (B), the position of the nuclei backtracked from 10 gnrh3:eGFP-negative (C, pink), 10 lens (D, yellow) and 7 gnrh3:eGFP-positive (E, blue) cells at each timepoint. The embryo is shown with anterior up; GFP expression detected caudally is ectopic and does not reflect endogenous gnrh3 expression. Scalebars represent 40 μm. (F) Schematic representation of an embryonic head at 36 hpf and the anterior neural plate (NP, dark grey) and adjacent preplacodal ectoderm (light grey) at 12 hpf. The 36 hpf head shows the colour code of the backtracked lineages, and the position of backtracked nuclei at 12 hpf is indicated in the preplacodal ectoderm. The 12 hpf representation shows the results obtained from 9 epithelia (5 embryos) for 30 gnrh3:eGFP-positive cells and 32 gnrh3:eGFP-negative cells; the 10 lens cells were backtracked from a pair of epithelia in a single 4D dataset only. |
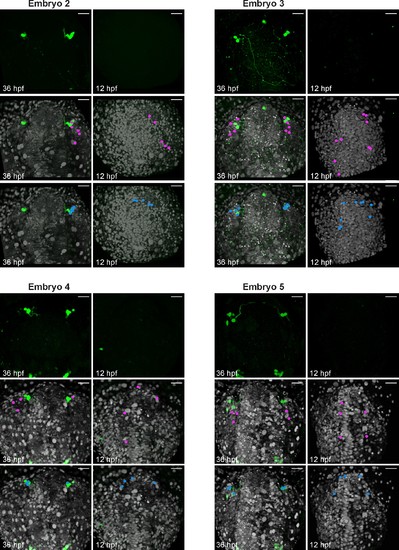
Backtracking data from individual Tg(gnrh3:eGFP) embryos. Confocal projections extracted from 4D datasets at 36 and 12 hpf for 4 embryos analysed and not shown in Figure 3 showing the GFP channel alone, and the position of the backtracked nuclei of gnrh3:eGFP-negative (pink) and gnrh3:eGFP-positive (blue) cells at both timepoints. Backtracked nuclei for the lens were only performed for Embryo 1 and are not shown. Embryos are shown with anterior up; whereas the GFP expression detected caudally is ectopic and does not reflect bona fide gnrh3 expression, the GFP+ axons seen in Embryo 3 extend from the trigeminal ganglia, which do expression gnrh3 endogenously. Scalebars represent 40 μm. |
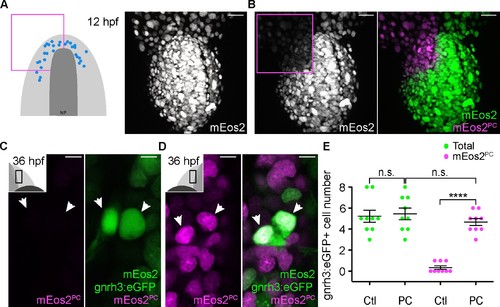
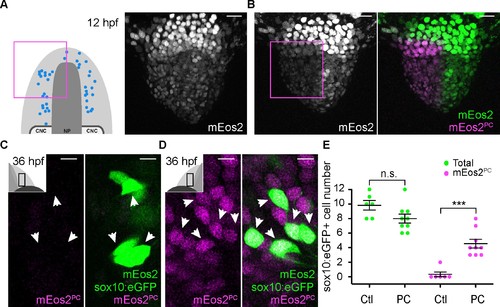
Lineage reconstruction reveals an anterior preplacodal ectoderm origin for Gnrh3 neurons: photoconversion. (A,B) Confocal projections of NLS-mEos2 loaded, Tg(gnrh3:eGFP) embryos at 12 hpf before (A) and after photoconversion (B). The first panel in (A) shows a schematic representation of the anterior neural plate (NP, dark grey) and adjacent preplacodal ectoderm (light grey) at 12 hpf indicating the origin of backtracked gnrh3:eGFP-positive cells (blue dots) and the photoconverted area (magenta square), which is also indicated on the confocal projection shown in (B) after photoconversion. Scalebars represent 30 μm. (C,D) Single confocal sections of olfactory epithelia from Tg(gnrh3:eGFP) embryos at 36 hpf showing the expression of eGFP from the transgene (cytoplasmic green), unconverted NLS-mEos2 (mEos2; nuclear green) and converted NLS-mEos2 (mEos2PC; nuclear magenta). Insets in (C) and (D) shows a schematic representation of an embryonic head at 36 hpf indicating the region analysed (black rectangle). Scalebars represent 5 μm. (E) Counts of cells expressing eGFP from the Tg(gnrh3:eGFP) transgene or eGFP and photoconverted mEos2 (mEos2PC) on the control (Ctl) versus photoconverted (PC) sides of the embryo at 36 hpf. No difference in the number of eGFP-positive cells is apparent between the Ctl and PC conditions (5.2 ± 0.6 versus 5.4 ± 0.5 cells per epithelium, n = 9 epithelia). Conversely, while a number of cells equivalent to the entire gnrh3:eGFP+ population is also mEos2PC-positive on the photoconverted side, virtually no eGFP/mEos2PC-double positive cells are detected on the control side (4.6 ± 0.3 versus 0.3 ± 0.2 cells per epithelium, n = 9 epithelia). Mean ±s.e.m. P values are calculated using a two-tailed Student's t-test, n.s. not significant, ****p<0.0001. |

Microvillous sensory neurons derive from preplacodal precursors: backtracking. (A–C) Confocal projections from a representative 4D dataset at 36, 28, 20 and 12 hpf showing the position of the nuclei backtracked from 10 sox10:eGFP-negative (A, pink), 10 lens (B, yellow) and 10 sox10:eGFP-positive (C, blue) cells at each timepoint. The embryo is shown with anterior up. Scalebars represent 40 μm. (D) Schematic representation of an embryonic head at 36 hpf and the anterior neural plate (NP, dark grey) and adjacent preplacodal ectoderm (light grey) at 12 hpf; the cranial neural crest (CNC) at the earlier stage is indicated. While the 36 hpf head shows the colour code of the backtracked lineages, the position of backtracked nuclei at 12 hpf is indicated in the preplacodal ectoderm. The 12 hpf schema represents the results obtained from 7 epithelia (4 embryos) for 41 sox10:GFP-positive cells and 44 sox10:eGFP-negative cells; the 10 lens cells were backtracked from a pair of epithelia in a single 4D dataset only. |
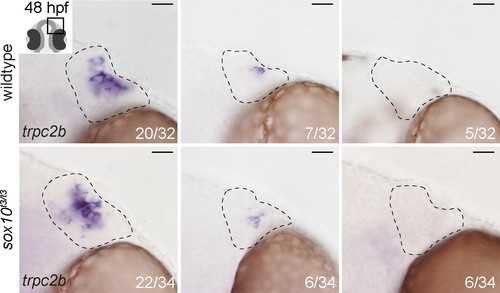
Expression of endogenous trpc2b is unchanged in sox10t3/t3 mutant embryos relative to wildtype siblings. Representative bright-field images of in situ hybridisation against endogenous trpc2b transcripts in wildtype or sox10t3/t3 mutant epithelia showing high and low numbers of expressing cells or no expressing cells. The number of epithelia binned for each category over the total number of epithelia analysed is indicated. Dotted lines highlight the olfactory epithelia and scalebars represent 20 μm. |
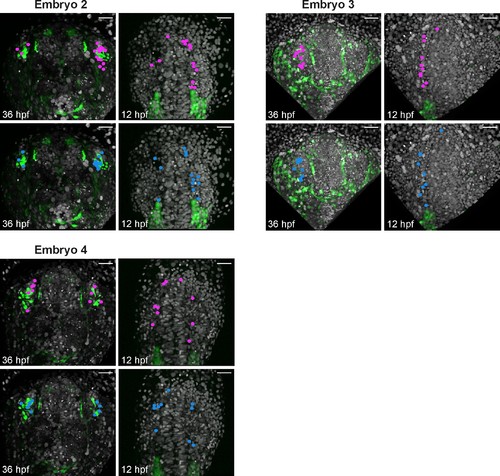
Backtracking data from individual Tg(sox10:eGFP) embryos. Confocal projections extracted from 4D datasets at 36 and 12 hpf for 3 embryos analysed and not shown in Figure 5 showing the position of the backtracked nuclei of sox10:eGFP-negative (pink) and sox10:eGFP-positive (blue) cells at both timepoints. Backtracked nuclei for the lens were only performed for Embryo 1 and are not shown. Embryos are shown with anterior up. Scalebars represent 40 μm. |
Microvillous sensory neurons derive from preplacodal precursors: photoconversion. (A,B) Confocal projections of NLS-mEos2 loaded, Tg(−4.9sox10:eGFP) embryos at 12 hpf before (A) and after photoconversion (B). The first panel in (A) shows a schematic representation of the anterior neural plate (NP, dark grey), adjacent preplacodal ectoderm (light grey) and cranial neural crest (CNC) at 12 hpf indicating the origin of backtracked sox10:eGFP-positive cells and the photoconverted area (magenta square), which is also indicated on the projection shown in (B) after photoconversion. Scalebars represent 30 μm. (C,D) Single confocal sections of olfactory epithelia from Tg(−4.9sox10:eGFP) embryos at 36 hpf showing the expression of eGFP from the transgene (cytoplasmic green), unconverted NLS-mEos2 (mEos2; nuclear green) and converted NLS-mEos2 (mEos2PC; nuclear magenta). Insets in (C) and (D) shows a schematic representation of an embryonic head at 36 hpf, dorsal view, indicating the area analysed (black rectangle). Scalebars represent 5 μm. (E) Counts of cells expressing eGFP from the Tg(−4.9sox10:eGFP) transgene or eGFP and photoconverted mEos2 (mEos2PC) on the control (Ctl) versus photoconverted (PC) sides of the embryo at 36 hpf. No difference in the number of eGFP-positive cells is apparent between the Ctl and PC conditions (9.8 ± 0.7 versus 8 ± 0.6 cells per epithelium, n = 9 and 6, respectively). Conversely, while numerous sox10:eGFP+ cells are also mEos2PC-positive on the photoconverted side, virtually no eGFP/mEos2PC-double positive cells are detected on the control side (4.6 ± 0.6 versus 0.3 ± 0.3 cells per epithelium, n = 9 and 6, respectively). Shown are mean ±s.e.m. P values are calculated using a two-tailed Student's t-test, n.s. not significant, ***p=0.0001. |