
- Title
-
Zebrafish Regulatory T Cells Mediate Organ-Specific Regenerative Programs
- Authors
- Hui, S.P., Sheng, D.Z., Sugimoto, K., Gonzalez-Rajal, A., Nakagawa, S., Hesselson, D., Kikuchi, K.
- Source
- Full text @ Dev. Cell

ZFIN is incorporating published figure images and captions as part of an ongoing project. Figures from some publications have not yet been curated, or are not available for display because of copyright restrictions. |
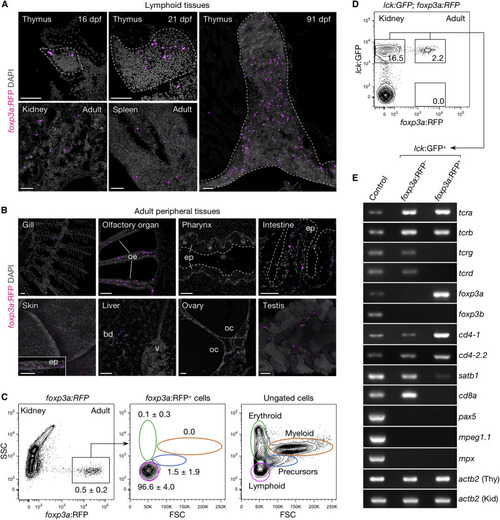
Distribution and Characterization of Zebrafish foxp3a+ Cells (A and B) foxp3a:RFP+ cells in lymphoid (A) and adult peripheral tissues (B). (C and D) FACS analysis of total kidney cells from adult foxp3a:RFP (C) and lck:GFP;foxp3a:RFP fish (D). The percentage of cells in each gate are indicated in the plots (C; mean ± SD, n = 5). The lymphoid gate from (C) is shown in (D). (E) Semi-qRT-PCR analysis of purified lck:GFP+foxp3a:RFP− (upper-left gate in D) and lck:GFP+foxp3a:RFP+ cells (upper-right gate in D). Thymus (Thy) and kidney (Kid) cell suspension was used as control for T cell genes and non-T cell genes. bd, bile duct; ep, epithelium; oe, olfactory epithelium; oc, oocyte; v, vein; FSC, forward scatter; SSC, side scatter. Scale bars, 50 μm. EXPRESSION / LABELING:
|
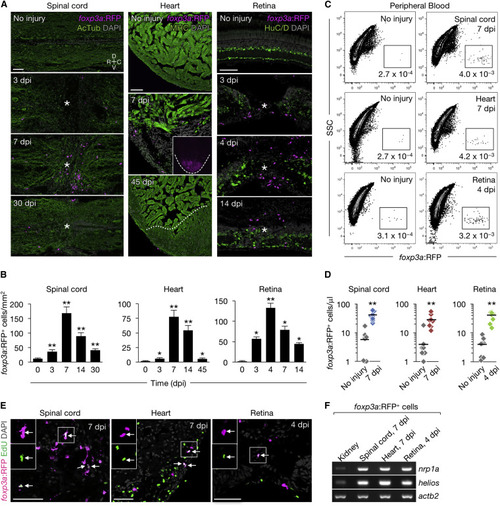
Zebrafish foxp3a+ Cells Infiltrate Regenerating Tissues (A) Sections of injured and uninjured foxp3a:RFP tissues. Immunofluorescence for acetylated Tubulin (AcTub), myosin heavy chain(MHC), and HuC/D marks nerves, cardiac muscle, and neuronal cells, respectively. Asterisks indicate injury epicenter. The dashed line in the inset outlines the ventricle, and the dotted line indicates the border of the regenerated muscle. (B) Quantification of foxp3a:RFP+ cells in A (mean ± SEM, n = 5–8). Uninjured tissues are indicated as 0 dpi. (C) FACS analysis of peripheral blood foxp3a:RFP+ cells. The percentages of cells in each fraction are shown in the plot. (D) Quantification of foxp3a:RFP+ cells in (C) (n = 8). (E) EdU labeling of injured foxp3a:RFP tissues. EdU was injected intraperitoneally at 4, 5, and 6 days after spinal cord and heart injury, or 3 days after retina injury. Arrows point to co-labeled cells. Insets: single-channel images of the marked regions. (F) Semi-qRT-PCR analysis of purified foxp3a:RFP+ cells. C, caudal; D, dorsal; R, rostral; V, ventral. Confocal projections of z stacks are shown in (A) and (E). ∗p < 0.01, ∗∗p < 0.01, Mann-Whitney U test. Scale bars, 50 μm. |

zTreg Cells Are Required for Organ Regeneration (A) Spinal cord sections from control (left) and zTreg cell-ablated fish (right). (B) Retrograde tracing of axonal projections using Fluoro-Ruby (FR). Regenerating axons spanned the transection injury in control fish (left; 6/6) but not zTreg cell-depleted fish (right; 1/6; p < 0.05). (C) Quantification of regeneration in (A) (n = 6–8). (D) Swim tracking of individual animals after spinal cord injury. (E) Quantification of total distance moved in (D) (mean ± SEM, n = 8–14). (F) Picro-Mallory staining of heart sections from control (left) and zTreg cell-ablated fish (right). (G) Quantification of regeneration in (F) (n = 7–10). (H) Quantification of scar tissue size (left) and myocardial wall thickness (right) in (F) (mean ± SEM, n = 10). (I) Luxol fast blue staining of retina sections from control (left) and zTreg cell-ablated fish (right). (J) Quantification of regeneration in (I) (n = 8). Asterisks indicate injury epicenter. Mtz, metronidazole; TG, foxp3a:NTR; Veh, vehicle; WT, wild-type. Confocal projections of z stacks are shown, except for the images in (F) and (I). NS, not significant; ∗p < 0.05, ∗∗p < 0.01, ∗∗∗∗p < 0.001, Fisher's exact test (B, C, G, and J), unpaired two-tailed Student's t test with Welch correction (E), and Mann-Whitney U test (H). Scale bars, 50 μm (A, B, F, I) and 0.1 m (D). See also Figure S1. |
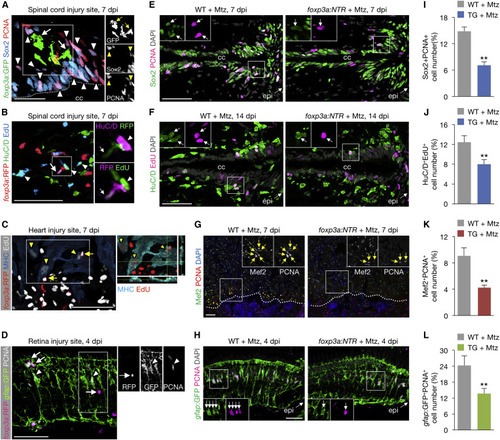
zTreg Cells Promote Regenerative Precursor Cell Proliferation (A and B) zTreg cells (arrows) interacting with proliferating neural progenitor cells (A; arrowheads point to Sox2+PCNA+) and newly differentiated neurons (B; arrowheads point to HuC/D+EdU+). Right panels show single-channel confocal sections of the demarcated regions. The dotted line marks the border of the central canal (cc). (C) zTreg cells (arrows) interacting with proliferating cardiomyocytes (arrowheads point to MHC+EdU+). Image on the right shows the xz and yz planes of the demarcated region. (D) zTreg cells (arrows) interacting with proliferating Müller glia (arrowheads point to gfap:GFP+PCNA+). Right panels show single-channel confocal sections of the demarcated region. (E–H) Proliferation of neural progenitor cells (E), newly differentiated neurons (F), cardiomyocytes (G), and Müller glia (H). Insets show single-channel confocal slices (E, F, and H) or epifluorescent images (G) of the demarcated regions. Arrows mark co-labeled cells. Dotted lines indicate the wound border. epi, injury epicenter. (I–L) Quantification of (E), (F), (G), and (H), respectively (mean ± SEM, n = 6–7). Confocal projections of z stacks are shown, except for the epifluorescent images in (G). ∗∗p < 0.01, Mann-Whitney U test. Scale bars, 50 μm. |
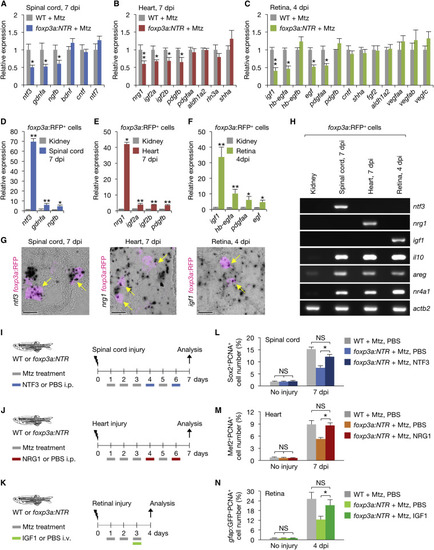
zTreg Cells Express Tissue-Specific Pro-regenerative Factors (A–C) qRT-PCR analysis of growth factor expression in injured tissues (mean ± SEM, n = 6). (D–F) qRT-PCR analysis of secreted factors in purified zTreg cells (mean ± SD; ∗p < 0.05, ∗∗p < 0.01). Gene expression is shown relative to the levels in kidney-derived zTreg cells. (G) In situ hybridization using RNAscope and immunofluorescence against TagRFP in damaged foxp3a:RFP tissues. Arrows indicate zTreg cells expressing mRNAs of ntf3 (left), nrg1(middle), or igf1(right). Single confocal sections are shown. (H) Semi-qRT-PCR analysis of zTreg cells purified from injured tissues and uninjured kidneys. (I–K) Experimental interventions involving NTF3 (I), NRG1 (J), or IGF1 (K) treatments. i.p., intraperitoneal injection; i.v., intravitreal injection. (L–N) Quantification of proliferating neural progenitor cells (L), cardiomyocytes (M), and Müller glia (N) (n = 5–8). Representative images are shown in Figures S4B, S4F, and S4G. ∗p < 0.05, ∗∗p < 0.01, Mann-Whitney U test (A–C and L–N) and Student's t test (D–F). Scale bars, 20 μm. See also Figure S4. EXPRESSION / LABELING:
PHENOTYPE:
|

Impaired Regeneration in Foxp3a-Deficient Zebrafish (A) Foxp3a domain structure and predicted truncated product of the Foxp3avcc6 allele. Numbers indicate amino acid positions. (B) Sections of Foxp3a-deficient (foxp3a−/−) and WT (foxp3a+/+) clutch-mate foxp3a:RFP fish. Asterisks indicate injury epicenter. (C–E) Proliferation of newborn neurons (C), cardiomyocytes (D), and Müller glia (E). Insets show single-channel confocal slices (C and E) or epifluorescent images (D) of the demarcated regions. Arrows mark co-labeled cells. Dotted lines indicate the wound border. (F–H) Quantification of (C), (D) and (E), respectively (mean ± SEM, n = 5–7). (I–K) qRT-PCR analysis of regeneration factor genes (mean ± SEM, n = 6). (L–N) Semi-qRT-PCR analysis of regeneration factor genes in purified foxp3a:RFP+ cells. +/+, foxp3a+/+; −/−, foxp3a−/−. Confocal projections of z stacks are shown, except for the epifluorescent images in (D). ∗p < 0.05, ∗∗p < 0.01, Mann-Whitney U test. Scale bars, 50 μm. See also Figure S7. EXPRESSION / LABELING:
PHENOTYPE:
|

Inducible ablation of zTreg cells, Related to Figure 4. (A) foxp3a:NTR fish were treated overnight on 3 consecutive days with vehicle (Veh) or metronidazole (Mtz), and total fish samples were used for qRT-PCR analysis of lck (T cells), pax5 (B cells), spi1b (myeloid cells), mpx (neutrophils), and mpeg1.1 and coronin1a (macrophages) (mean ± SEM, n = 5). Exposure of foxp3a:NTR fish to Mtz reduced endogenous foxp3a expression by approximately 85%, without altering the expression of other immune cell markers. Gene expression is shown relative to the levels in vehicle controls. (B) foxp3a:NTR fish were injured at the spinal cord and treated overnight with Veh (left) or Mtz (middle and right) at 1, 2, 3 and 5 dpi. The spinal cords were analyzed via immunofluorescence against TagCFP at 7 dpi (left and middle) and 14 dpi (right; after an 8-day interval without Mtz treatment). Asterisk, injury epicenter. (C) foxp3a:NTR fish were injured at the cardiac ventricle and treated overnight with Veh (left) or Mtz (middle and right) at 4, 5, and 6 dpi. The hearts were analyzed at 7 dpi (left and middle) and 10 dpi (right; after a 3-day interval without Mtz). Dotted line, wound border. (D) foxp3a:NTR fish were injured at the retina and treated overnight with Veh (left) or Mtz (middle and right) at 1, 2, and 3 dpi. The retinas were analyzed at 4 dpi (left and middle) and 14 dpi (right; after a 11-day interval without Mtz treatment). Asterisk, injury epicenter. (E) zTreg cell ablation protocol used throughout this study. After 7 days, Mtz or Veh treatments were performed every second day for the duration of the experiment. (F–H) Clutch mate WT and foxp3a:NTR fish were subjected to injury and drug treatments as described in (E), and foxp3a expression in the spinal cord (F), heart (G), and retina (H) was measured by qRT-PCR (mean ± SEM, n = 5). (I) qRT-PCR analysis of inflammatory cytokine genes in foxp3a:NTR fish after a 30- day treatment regimen as described in E (mean ± SEM, n = 5). dpt, days post treatment. Single confocal sections are shown in B-D. DAPI: 4',6-diamidino-2- phenylindole. *P < 0.05, **P < 0.01, ***P < 0.001, Mann–Whitney U test. NS, not significant. Scale bars, 50 μm. |

Survival gene expression and apoptosis in injured zTreg cell depleted tissues, Related to Figure 5. (A–C) qRT-PCR analysis of survival factors in injured spinal cords (A), hearts (B), and retinas (C) from control and zTreg cell-depleted fish (mean ± SEM, n = 6). (D–F) Immunofluorescence for activated Caspase-3. Arrows indicates apoptotic neurons (D; HuC/D+Caspase- 3+), cardiomyocytes (E; MHC+Caspase-3+), and Müller glia (F; gfap:GFP+Caspase-3+). Images show the rostral stump of a 7-dpi spinal cord. cc, central canal; epi, injury epicenter. Dotted line, wound border plane. (G–I) Quantification of D–F (mean ± SEM, n = 5). Mann–Whitney U test. NS, not significant. Scale bars, 100 μm. |

Regeneration factor administration and receptor gene expression in regenerating parenchymal cells, Related to Figure 6. (A) NTF3 treatment regimen. NTF3 or PBS was injected intraperitoneally (i.p.) from 6 dpi. (B–E) Proliferation of neural progenitor cells (B; Sox2+PCNA+), immature neurons (C; HuC/D+EdU+), cardiomyocytes (D; Mef2+PCNA+) and Müller glia (E; gfap:GFP+PCNA+). Insets show single-channel confocal slices (B, C, E) or epifluorescent images (D) of the demarcated regions. Dotted line, wound border plane. (F) Quantified proliferating immature neurons (HuC/D+EdU+) in C (mean ± SEM, n = 5). (G–I) Semi-qRT-PCR analysis of purified gfap:GFP+ cells from spinal cords (G; ependymo-radial glial cells), cmlc2:GFP+ cells from hearts (H; cardiomyocytes), and gfap:GFP+ cells from retinas (I; Müller glia). Confocal projections of z-stacks are shown, except for the epifluorescent images shown in D. *P < 0.05, **P < 0.01, Mann–Whitney U test. NS, not significant. Scale bars, 50 μm. |
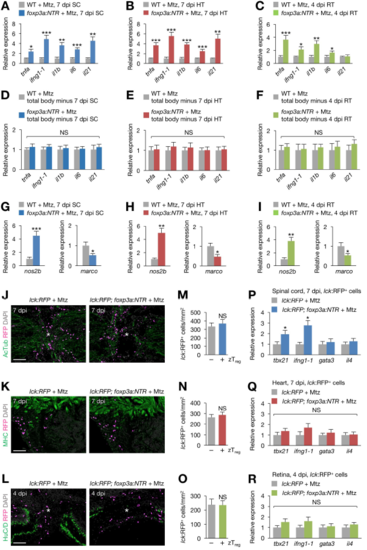
zTreg cell-mediated immunomodulation during regeneration, Related to Figure 6. (A–C) qRT-PCR analysis of inflammatory gene expression in injured spinal cords (A), hearts (B), and retinas (C) from control and zTreg celldepleted fish (mean ± SEM, n = 6). (D–F) Expression levels of the same genes analyzed in A–C were unchanged in the remainder of the fish after removing the injured spinal cord (D), heart (E), or retina (F) (mean ± SEM, n = 5). (G–I) The expression of M1 macrophage marker nos2b and M2 macrophage marker marco was measured in injured spinal cord (G), heart (H), and retina (I) samples obtained from Mtz-treated WT and foxp3a:NTR fish (mean ± SEM, n = 6). (J–L) Sections of spinal cords (J), hearts (K), and retinas (L) from lck:RFP (left) or lck:RFP; foxp3a:NTR fish (right) treated with Mtz (mean ± SEM, n = 6). Asterisks, injury epicenter. (M–O) Quantification of J (M), K (N), and L (O). zTreg (+) and (−) indicate zTreg cell ablated or non-ablated samples, respectively (mean ± SEM, n = 6). (P–R) qRT-PCR analysis of the expression of effector T cell marker genes in T cells (lck:RFP+ cells) purified from damaged spinal cords (P), hearts (Q), retinas (R) (mean ± SD; *P < 0.05). AcTub, Acetylated Tubulin; HT, heart; marco, macrophage receptor with collagenous domain; MHC, myosin heavy chain; nos2b, inducible nitric oxide synthase 2b; RT, retina; SC, spinal cord. *P < 0.05, **P < 0.01, ***P < 0.001, NS, not significant, Mann–Whitney U test (A–I, M–O), Student’s t-test (P–R). Scale bars, 100 μm. |
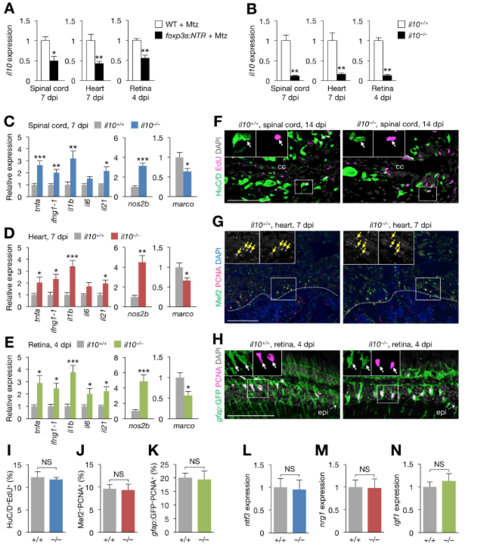
Regeneration phenotype of il10–/– zebrafish, Related to Figure 6. (A) il10 expression in injured spinal cords (left), hearts (middle), and retinas (right) from control and zTreg cell-depleted fish (mean ± SEM, n = 6). (B) il10 expression in injured spinal cords (left), hearts (middle), and retinas (right) from clutch mate WT (il10+/+) and il10–/– fish (mean ± SEM, n = 5). (C–E) qRT-PCR analysis of inflammatory cytokine (left) and M1 macrophage marker (middle) and M2 macrophage marker (right) gene expression in injured spinal cords (C), hearts (D), and retinas (E) from il10+/+ and il10–/– fish (mean ± SEM, n = 5). Gene expression is normalized to the levels in WT fish. (F–H) Proliferation of immature neurons (F; HuC/D+EdU+), cardiomyocytes (G; Mef2+PCNA+) and Müller glia (H; gfap:GFP+PCNA+) in injured spinal cords (F), hearts (G), and retinas (H) from il10+/+ and il10–/– fish. Insets show single-channel confocal slices (F, H) or epifluorescent images (G) of the demarcated regions. The rostral spinal cord stumps are shown in F. Arrows indicate co-labeled cells, and dotted lines indicate the wound border plane. (I–K) Quantification of F (I), G (J), and H (K). (mean ± SEM, n = 5). (L–N) qRT-PCR analysis of regeneration factor genes in injured spinal cords (L), hearts (M), and retinas (N) from il10+/+ and il10–/– fish (mean ± SEM, n = 5). cc, central canal; epi, injury epicenter. *P < 0.05, **P < 0.01, ***P < 0.001, Mann–Whitney U test. Scale bars, 100 μm. |
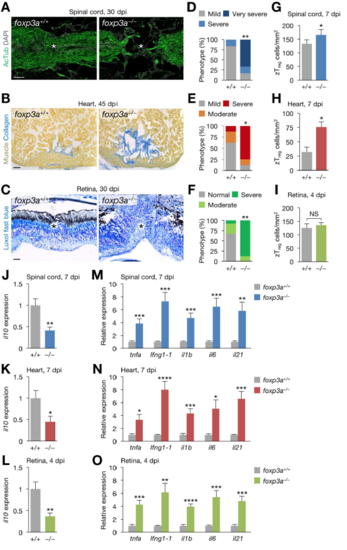
Regeneration phenotype of foxp3a–/– zebrafish, Related to Figure 7. (A) Sections of 30 dpi spinal cords from clutch mate WT (foxp3a+/+; left) and foxp3a–/– fish (right). Immunofluorescence for acetylated Tubulin (AcTub) marks nerves. Asterisks, injury epicenter. (B) Picro-Mallory staining of sections from 45 dpi hearts from WT (left) and foxp3a–/– fish (right). (C) Luxol fast blue staining of sections from 30 dpi retinas from WT (left) and foxp3a–/– fish (right). Asterisks, injury epicenter. (D–F) Quantification of regeneration in A–C (n = 6–8). (G–I) Quantification of zTreg cells in Figure 7B (mean ± SEM, n = 5). (J–L) il10 expression in injured spinal cords (J), hearts (K), and retinas (L) from WT and foxp3a–/– fish (mean ± SEM, n = 5). (M–O) The expression of inflammatory cytokine genes in injured spinal cords (M), hearts (N), and retinas (O) from WT and foxp3a–/– fish (mean ± SEM, n = 5). Gene expression is normalized to the levels in WT fish. *P < 0.05, **P < 0.01, ***P < 0.005, ****P < 0.0001, Fisher’s exact test (D–F), Mann–Whitney U test (G–O). Scale bars, 50 μm. PHENOTYPE:
|
Reprinted from Developmental Cell, 43, Hui, S.P., Sheng, D.Z., Sugimoto, K., Gonzalez-Rajal, A., Nakagawa, S., Hesselson, D., Kikuchi, K., Zebrafish Regulatory T Cells Mediate Organ-Specific Regenerative Programs, 659-672.e5, Copyright (2017) with permission from Elsevier. Full text @ Dev. Cell