
- Title
-
Oncogenic Role of THOR, a Conserved Cancer/Testis Long Non-coding RNA
- Authors
- Hosono, Y., Niknafs, Y.S., Prensner, J.R., Iyer, M.K., Dhanasekaran, S.M., Mehra, R., Pitchiaya, S., Tien, J., Escara-Wilke, J., Poliakov, A., Chu, S.C., Saleh, S., Sankar, K., Su, F., Guo, S., Qiao, Y., Freier, S.M., Bui, H.H., Cao, X., Malik, R., Johnson, T.M., Beer, D.G., Feng, F.Y., Zhou, W., Chinnaiyan, A.M.
- Source
- Full text @ Cell

ZFIN is incorporating published figure images and captions as part of an ongoing project. Figures from some publications have not yet been curated, or are not available for display because of copyright restrictions. |
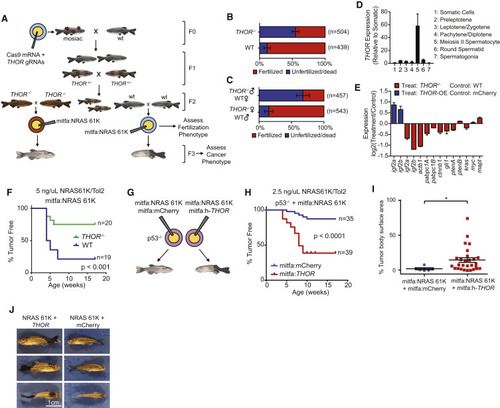
THOR Regulates Melanoma Onset in Zebrafish (A) Schematic depicting creation of THOR-knockout zebrafish model. (B) Fraction of fertilized zebrafish embryos derived from wild-type or THOR-knockout zebrafish (−/−) 6 hr following mating. ∗ indicates p ≤ 0.01 by a χ2 test. Data show mean ± SD from two independent experiments. (C) Fraction of fertilized 6-hpf zebrafish embryos derived from wild-type female crossed with THOR-knockout male or THOR-knockout female crossed with wild-type male. ∗ indicates p ≤ 0.01 by a χ2 test. Data show mean ± SD from two independent experiments. (D) Expression levels of z-THOR in testicular somatic cells as well as in 6 Hoechst-profiled subpopulations of testicular germ cells. Data show mean ± SD. (E) Bar plot demonstrates expression of 12 zebrafish orthologs of the canonical IGF2BP1 target genes by qRT-PCR in zebrafish embryos. Expression represented as log2 of the fold change of either THOR−/− compared to wild-type embryos (red) or THOR overexpression compared to control mCherry. Data show mean ± SD from one of the two independent experiments. (F) Kaplan-Meier curve of melanoma free period for mitfa promoter driven NRAS 61K zebrafish in either THOR−/− background or wild-type background. p values were determined using a log-rank test. (G) Schematic describing the generation of the h-THOR-overexpression melanoma zebrafish model. (H) Kaplan-Meier curve of melanoma-free period for p53−/− zebrafish co-injected with either mitfa promoter driven NRAS 61K + mitfa promoter driven human THOR or mitfa promoter driven NRAS 61K + mCherry. p values were determined using a log rank test. (I) Percentage of body area covered in melanoma for mCherry and h-THOR injected zebrafish also containing mitfa-promoter-driven NRAS 61K. ∗ indicates p ≤ 0.01 obtained by a two-tailed Student’s t test. (J) Specimen example of NRAS 61K driven melanomas in zebrafish co-injected with mitfa-promoter-driven h-THOR or mitfa-promoter-driven mCherry in a p53−/− background. Data show mean ± SE for all panels with error bars. See also Figure S7. |

Characterization of THOR Transcript, Coding Potential, and Tissue Expression, Related to Figure 1 (A) Northern blot of endogenous THOR in H1299 cells, and of H1437 cells expressing LacZ control, THOR, and THOR with the addition of siRNA targeting THOR. Blot of gapdh provided as a control. (B) Bar plot depicting the qPCR expression of the long versus short THOR isoform. (C) qPCR expression of the long THOR isoform following addition of siRNA. (D) Northern blot of THOR in zebrafish kidney and testis. Blot of GAPDH provided as a control. (E) 5′ RACE for the THOR transcripts expressed by the lentiviral system. PCR agarose gel (left) confirms single band used in Sanger sequencing (right). (F) 3′ RACE for the THOR transcripts expressed by the lentiviral system. PCR agarose gel (left) shows two bands utilized in Sanger sequencing (right). (G) Coding probability scores for the transcripts were assessed by Coding Potential Assessment Tool (CPAT). NRAS and TP53 used as positive control, and SCHLAP1 as a negative control. (H) Coding probability scores for the PhyloCSF and CPC tools for THOR and MYC. Values less than 0 suggest a lack of coding potential. (I) Genome browser depiction of the THOR locus with aggregate ribosomal profiling track (red), aggregate poly-A RNA-seq track (green) and GENCODE v22 genome annotation obtained from the GWIPS-viz ribo-seq genome browser. (J) H&E image of the testis and surrounding tissue architecture. (K) H&E (left) and THOR ISH (right) for the human testis, rete, and adipose. |

THOR Genetic Model in Zebrafish Exhibits Melanoma Phenotype and Fertility Phenotype, Related to Figure 7 (A) Schematic representation of human and zebrafish THOR transcript structure and the guide RNA (gRNA) design used to delete the conserved transcript region of zebrafish THOR via CRISPR/Cas9 genome editing (top). Validation of THOR knockout at both DNA (genotyping) and RNA (qRT-PCR) level (bottom). Data show mean ± SD. (B) Kaplan-Meier curve of tumor free period for p53−/− zebrafish (solid lines) and p53 wild-type zebrafish (dotted lines) co-injected with either mitfa promoter driven NRAS 61K + mitfa promoter driven human THOR (red) or mitfa promoter driven NRAS 61K + mCherry (blue). (C and D) Cell selection is visualized in a “Hoechst Blue”/“Hoechst Red” contour plot, in which the density of the cells is displayed as contour lines that form circular contours upon high cell density. Contour plots shown for sorted zebrafish spermatocytes from (C) wild-type zebrafish and (D) THOR knockout zebrafish. (E) GSEA results shown for all 5 MSigDB signatures related to meiosis for gene expression changes following siRNA mediated THOR knockdown determined by RNA-seq. Genes ranked by –log(pval)∗(Fold Change). (F) Representative GSEA plot for the REACTOME_MEIOTIC_SYNAPSE gene signature. (G) Volcano plot for gene expression changes following THOR knockdown determined via DESeq. Meiotic histone genes in the MEIOTIC_SYNAPSE gene signature shown in blue. (H) Representative image of zebrafish with melanoma. (I–L) (I and J) Immunohistochemistry for melanoma in p53 wild-type background with endogenous THOR. (K and L) Immunohistochemistry for melanoma in p53 knockout background zebrafish with exogenous h-THOR. (I and K) H&E staining (100x) of melanoma. (J) and (L), Immunohistochemistry staining (100x) for Melan-A of melanoma. PHENOTYPE:
|
Reprinted from Cell, 171, Hosono, Y., Niknafs, Y.S., Prensner, J.R., Iyer, M.K., Dhanasekaran, S.M., Mehra, R., Pitchiaya, S., Tien, J., Escara-Wilke, J., Poliakov, A., Chu, S.C., Saleh, S., Sankar, K., Su, F., Guo, S., Qiao, Y., Freier, S.M., Bui, H.H., Cao, X., Malik, R., Johnson, T.M., Beer, D.G., Feng, F.Y., Zhou, W., Chinnaiyan, A.M., Oncogenic Role of THOR, a Conserved Cancer/Testis Long Non-coding RNA, 1559-1572.e20, Copyright (2017) with permission from Elsevier. Full text @ Cell