
- Title
-
Etv2-miR-130a-Jarid2 cascade regulates vascular patterning during embryogenesis
- Authors
- Singh, B.N., Tahara, N., Kawakami, Y., Das, S., Koyano-Nakagawa, N., Gong, W., Garry, M.G., Garry, D.J.
- Source
- Full text @ PLoS One

miR-130a regulates endothelial patterning in vivo. A, B, qPCR analysis of endothelial transcripts, kdr1 and tek at 48hpf using RNA from control and miR-130a morphants. C, Whole-mount in situ hybridization images of control and miR-130a morphants at 48 hpf using cdh5 and kdr1 probes. Note the defective nature of vascular development and reduced expression of these transcripts in miR-130a morphants (arrowheads). D, E, Brightfield microscopic images revealed no major changes in gross morphology of mismatch control and miR-130a morphants. F-I, Lateral fluorescence images of Tg(fli1a:EGFP) zebrafish lines revealed defective vasculature in miR-130a morphants (white arrowheads) at 48 hpf (F, G) and 72 hpf (H, I) time periods. J, K, Quantitative analysis of the number of defective zebrafish embryos with perturbed inter-somitic vessels (ISVs) at 48 hpf and 72 hpf. L, M, ImageJ (L) and FACS (M) analyses of EGFP+ cells revealed significantly reduced EGFP intensity and counts in miR-130a morphants. N, Lateral fluorescence and brightfield images of Tg(fli1a:EGFP) zebrafish lines co-injected with miR-130a morpholinos and LNA modified scrambled oligos and miR-130a mimics at 72hpf. Panel N’ and N” shows the enlarged images of the boxed area in panel N. Note the restoration of the vascular structures following co-injection with miR-130a morpholinos and miR-130a mimics (N’, N”; arrowheads). O, Quantitative analysis of the number of defective zebrafish embryos with perturbed inter-somitic vessels (ISVs) 72 hpf. Error bars indicate SEM (n = 3; *p<0.05; **p < 0.01). Scale bar: 200 μm. EXPRESSION / LABELING:
PHENOTYPE:
|
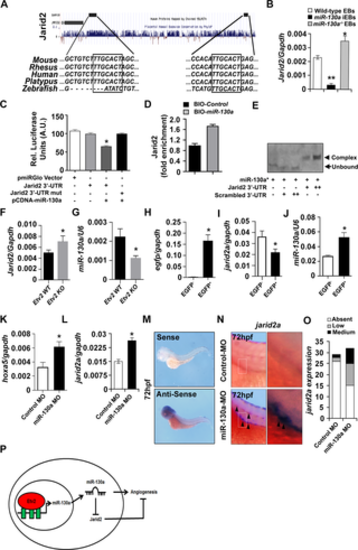
miR-130a targets Jarid2 in the developing vasculature. A, MultiAllign sequence alignment of Jarid2 3’ UTR showing conservation across different vertebrates with a conserved miR-130a binding motif in the 3’-UTR region. B, qPCR analysis of Jarid2a expression using RNA isolated from wild-type EBs, miR-130a iEBs and miR-130a-null EBs at d6 of differentiation. C, Luciferase activity of PGK-Luc-Jarid2-3’-UTR and PGK-Luc-Jarid2-3’-UTR mutant reporter constructs in the presence of pCMV-miR-130a constructs. D, miRNA pull down assay using biotinylated-miR-130a showing ~1.75-fold enrichment of Jarid2 3’-UTR in the miR-130a transfected cells as compared to scrambled control. E, RNA-EMSA assay using 5’-IRDye700-labeled miR-130a (miR-130a*) to show direct binding of miR-130a and Jarid2 3’-UTR region. Note the presence of a complex formation upon co-incubation of Jarid2 3’-UTR oligo with miR-130a resulted, but not in the scrambled oligo. F, G, qPCR analysis of Jarid2a and miR-130a transcripts using RNA isolated from age-matched wild-type control and Etv2-null mouse embryos at E8.5. H-J, qPCR analysis of egfp, jarid2a and miR-130a transcripts at 72hpf using RNA isolated from EGFP- and EGFP+ sorted cells obtained from Tg(fli1a:EGFP) transgenic lines. K, L, qPCR analysis of hoxa5a and jarid2a transcripts at 72hpf using RNA from control and miR-130a morphants. M, Whole-mount in situ hybridization images of the wild-type embryos using jarid2a sense and anti-sense probes at 72hpf. N, Whole-mount in situ hybridization images of control and miR-130a morphants at 72 hpf using jarid2a probes. Note the enhanced expression of jarid2a in the developing vasculature (arrowheads). O, Quantitative analysis of the number of zebrafish embryos with increased expression of jarid2a. P, Schematic showing the regulation of the Etv2-miR-130a-Jarid2 cascade in the angiogenic pathway. Error bars indicate SEM (n = 3; from 20 pooled embryos; *p<0.05; **p < 0.01). EXPRESSION / LABELING:
PHENOTYPE:
|

miR-130a regulates endothelial patterning in vivo. A, B, Brightfield microscopic images revealed no major changes in gross morphology of mismatch control-2 and miR-130a morphants. C-F, Lateral fluorescence images of Tg(fli1a:EGFP) zebrafish lines revealed defective vasculature in miR-130a morphants (white arrowheads) at 48 hpf (C, D) and 72 hpf (E, F) time periods. G, Quantitative analysis of the number of defective zebrafish embryos with perturbed inter-somitic vessels (ISVs) at 48 hpf and 72 hpf. Error bars indicate SEM (**p<0.01). PHENOTYPE:
|

Jarid2 over-expression inhibits vascular development. A, Tube formation assay using HUVEC cells following transfection with the vector and Jarid2 constructs, respectively. White arrow indicates the defective tube formation B, Quantitative analysis of the number of vascular tubes per field at 10x magnigfication. Note the decreased number of tubes following over-expression of Jarid2. C, Quantitative analysis of tube formation following co-injection of Jarid2 and miR-130a mimics. Note the restoration of tube formation upon co-expression of Jarid2 and miR-130a mimics. Error bars indicate SEM (*p<0.05). |