
- Title
-
Targeting erythropoietin protects against proteinuria in type 2 diabetic patients and in zebrafish
- Authors
- She, J., Yuan, Z., Wu, Y., Chen, J., Kroll, J.
- Source
- Full text @ Mol Metab
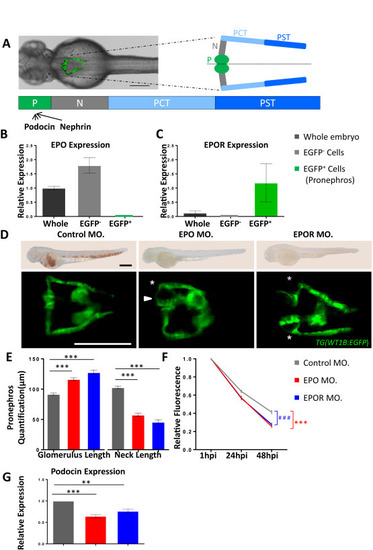
Genetic inactivation of EPO signaling induced pronephros structure alteration and proteinuria in zebrafish. A. Left: zebrafish embryo, shown in a dorsal view, with pronephros depicted in green fluorescence. Right: pronephros drawing showed segmental organization (P = podoycytes/glomerulus; N = neck; PCT = Proximal convoluted tubule; PST = Proximal straight tubule). Below: expression of indicated genes, podocin and nephrin, related to split diagram formation in zebrafish. B, C. Relative expression of EPO and EPOR at 48 hpf analyzed by RT-PCR from RNA isolated from whole zebrafish embryos, EGFP negative (EGFP−) cell fraction (entire embryo excluding pronephros), and pronephros (EGFP+) cell fraction. While EPO was mostly expressed in EGFP− cell traction, EPOR was preferentially expressed in pronephros (EGFP+). D. As compared to control morphants (Control MO.), EPO morphants (EPO MO.) and EPOR morphants (EPOR MO.) showed an enlarged glomerulus (white arrow head) and a highly shortened pronephric neck (white asterisks). The fluorescence microscopy images were taken at 48 hpf of TG(WT1B:EGFP) zebrafish embryos. White scale bar: 200 μm. The light microscopy images above showed a large percentage or nearly completely loss of hemoglobin, i.e. almost absence of red blood cells in EPO MO. and EPOR MO. at 48 hpf, indicating functionality of EPO and EPOR mopholinos. In contrast, Control MO. injected embryos had a high abundance of red blood cells. Black scale bar in O-dianiside stain: 500 μm. E. Altered pronephros structure in EPO morphants and EPOR morphants as indicated by length of the neck and length of glomerulus was quantified in three independent experiments. (n = 56–78 embryos per group). F. Increased loss of intracardiac injected 70 kDa dextran–FITC at 24 hpi and 48 hpi in EPO morphants and EPOR morphants as compared to control morphants showing three independent experiments. (n = 41–50 embryos per group). G. Relative expression of Podocin at 48 hpf analyzed by RT-PCR from RNA isolated from EPO MO., EPOR MO., and Control MO. H. Relative expression of Nephrin at 48 hpf analyzed by RT-PCR from RNA isolated from EPO MO., EPOR MO., and Control MO. Data were analyzed using the Student‘s t-test (E and F) or Mann–Whitney-U-test (G and H). Mean ± s.e.m. ns. Not significant. **p < 0.01, *** or ###p < 0.001. |

EPO and EPOR CRIPSRants phenocopies EPO and EPOR morphants in zebrafish. A, B. Schematic illustration of EPO and EPOR CRISPR target regions and sequence results of wildtype, EPO CRISPRant, and EPOR CRISPRants. C. Similar to morphants, EPO CRISPR, and EPOR CRISPR injected zebrafish embryos (EPO CRISPR and EPOR CRISPR) also showed an enlarged glomerulus (white arrow head) and a highly shortened pronephric neck (white asterixis) at 48 hpf in TG(WT1B:EGFP) zebrafish embryos. Light microscopy images above show strongly reduced hemoglobin concentrations using O-dianiside stain in EPO CRISPR and EPOR CRISPR injected zebrafish embryos as compared to Control CRISPR injected embryos at 48 hpf indicating efficient knockout of both genes. D. Quantification of data shown in C in three independent experiments for each group. (n = 43–47 embryos per group). E. Increased loss of intracardiac injected 70 kDa dextran–FITC at 24 hpi and 48 hpi in EPO CRISPR and EPOR CRISPR injected zebrafish embryos as compared to its respective control performed in three independent experiments. (n = 40–48 embryos per group). All data were analyzed using the Student‘s t-test. Mean ± s.e.m. *** or ###p < 0.001. |
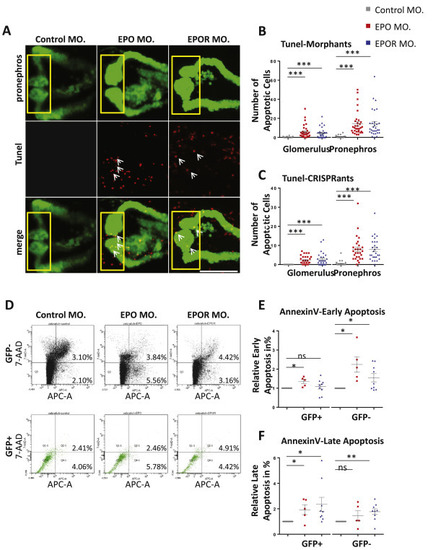
Knockdown of EPO and EPOR increased apoptosis within zebrafish pronephros. A. Increased apoptotic cell number (white arrows) and altered pronephros structure in EPO MO. and EPOR MO. as compared to Control MO. Confocal images of TUNEL-stained TG(WT1B:EGFP) zebrafish embryos at 48 hpf are shown. The yellow square highlighted glomerulus of zebrafish pronephros. White arrows labeled apoptotic cells shown in red color; pronephros was labeled in green. White scale bar: 100 μm. B. Quantification of glomerulus and total pronephros apoptotic cells (TUNEL) in EPO MO., EPOR MO. and Control MO. performed in three independent experiments as shown in Figure A (n = 28–32 embryos per group). C. Quantification of glomerulus and total pronephros apoptotic cells (TUNEL) in EPO CRISPRants, EPOR CRISPRants, and Control CRISPRants shown in Supplementary Figures performed in three independent experiments. (n = 28–30 embryos per group). D. FACS scan results for Annexin V stain in EPO MO. and EPOR MO. as compared to Control MO. E. Increased relative Annexin V-positive/7-AAD-negative cell fraction as an indicator of early apoptotic cells in EPO MO. and EPOR MO. as compared to Control MO. performed in at least three different experiments. Cells from 48 hpf zebrafish were harvested, stained with Annexin V-APC and 7-AAD and analyzed by FACS. F. Increased relative Annexin V-positive/7-AAD-positive cell fraction indicating late apoptotic cells in EPO MO. and EPOR MO. as compared to Control MO. performed in at least three different experiments. Data were analyzed using the Student‘s t-test (C and D). Mean ± s.e.m. ns not significant. ***p < 0.001. PHENOTYPE:
|
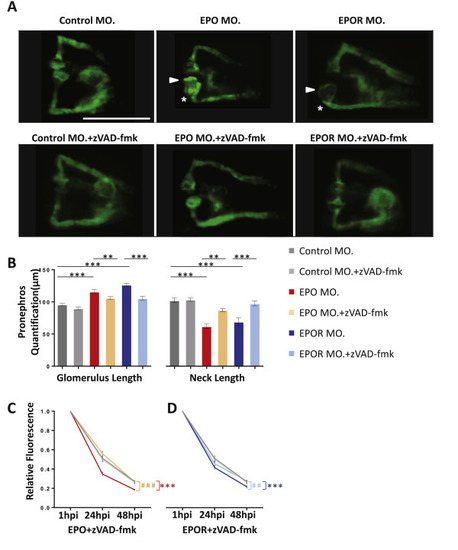
Apoptosis inhibition treatment partially rescued pronephros phenotype induced by EPO inactivation. A. Normalization of enlarged glomerulus (white arrow head) and shortened pronephric neck (white asterisks) in EPO MO. and EPOR MO. zebrafish embryos treated at 24 hpf with zVAD-fmk (300 μM) for 24 h. White scale bar: 200 μm. B. Quantification of data shown in Figure A performed in three independent experiments. (n = 40–52 embryos per group). **p ≤ 0.01 or ***p < 0.001 as indicated. C. Elevated loss of 70 kDa dextran–FITC fluorescence at 24 hpi and 48 hpi in EPO MO. zebrafish embryos was rescued by zVAD-fmk treatment (n = 41–43 embryos per group). Significance was given for EPO MO. against Control MO. as ***p < 0.001, and EPO MO. + zVAD-fmk against EPO MO. as ###p < 0.001. D. Elevated loss of 70 kDa dextran–FITC fluorescence at 24 hpi and 48 hpi in EPOR MO. zebrafish embryos was rescued by zVAD-fmk incubation (n = 41–47 embryos per group). Same Control MO. and Control MO. + zVAD-fmk were applied. Significance was given for EPOR MO. against Control MO. as ***p < 0.001, and EPOR MO. + zVAD-fmk against EPOR MO. as ##p < 0.01 as indicated. All data were analyzed using the Student‘s t-test. Mean ± s.e.m. |

EPO silencing aggravated pronephros structure and function in hyperglycemic zebrafish. A. Further enlarged glomerulus (white arrow head) and shortened pronephric neck (white asterixis) in EPO + Pdx1 morphants (EPO + Pdx1 MO.) as compared to Pdx1 morphants (Pdx1 MO.) alone. White scale bar: 200 μm. B. Quantification of data in Figure A performed in three independent experiments. (n = 55–69 embryos per group). ***p < 0.001 as indicated. C. Elevated loss of 70 kDa dextran–FITC fluorescence at 24 hpi and 48 hpi in Pdx1 MO. as compared to Control MO. but decreased loss of 70 kDa dextran–FITC fluorescence at 24 hpi and 48 hpi in EPO + Pdx1 MO. as compared to Control MO. (n = 39–44 embryos per group). Significance was given for Pdx1 MO. against Control MO. as ***p < 0.001, and for EPO + Pdx1 MO. against Control MO. as ###p < 0.001. All data were analyzed using the Student‘s t-test. Mean ± s.e.m. D. Schematic illustration that EPO and EPOR maintain kidney structure and function through repressing apoptosis and protect kidney pathogenesis under hyperglycemia condition. |

Ultramicroscopic pronephros structure alteration upon genetic inactivation of EPO signaling in zebrafish. A. Podocytes foot processes (PFP) and bowman space (BS) in Control Mo. are well developed. B. Upon EPOR knockdown, foot processes are immature and are unable to interdigitate to form an appropriate filtration barrier. Bowman space (BS) is completely lost. The white line indicates the scale bar corresponding to 1 μm length. PHENOTYPE:
|

EPO supplement attenuate kidney structure and split diagram function alteration via a EPOR-dependent manner in zebrafish. A. Intracardiac injection of hEPO normalized enlarged glomerulus (white arrow head) and shortened pronephric neck (white asterixis) in EPO MO. In contrast, pronephros alterations in EPOR MO. could not be rescued by hEPO injections. Morpholino injected zebrafish embryos were injected at 24 hpf with 1 nl control or 4 IU/mL hEPO solution into the heart. Light microscopy images show increased hemoglobin concentrations in EPO MO. embryos injected with hEPO as compared to EPO MO. embryos injected with control solution only. In EPOR MO. embryos, hEPO could not increase hemoglobin concentrations. White scale bar in pronephros structure: 200 μm. Black scale bar in O-dianiside stain: 500μm. B. Quantification of data shown in A done in three independent experiments for each group. (n = 34–51 embryos per group). ns = not significant, **p ≤ 0.01, ***p < 0.001. C. Elevated loss of 70 kDa dextran–FITC fluorescence at 24 hpi and 48 hpi could be normalized in EPO morphants injected with hEPO (n = 42–50 embryos per group). Mean ± standard error. Significance was given for EPO MO. + KCL against Control MO. + KCL as ***p < 0.001, and EPO MO. + KCL against EPO MO + hEPO as #p < 0.05. D. Elevated loss of 70 kDa dextran–FITC fluorescence at 24 hpi and 48 hpi could not be rescued in EPOR MO zebrafish embryos injected with hEPO (n = 40–44 embryos per group). The same Control MO. + KCL and Control MO. + hEPO were applied. Significance was given for EPOR MO. + KCL against Control MO. + KCL as ***p < 0.001, and EPOR MO. + KCL against EPOR MO + hEPO as not significant (ns). All data were analyzed using the Student's t-test. Mean ± s.e.m. |

hEPO partially reduced apoptotic cell number in EPO morphants but not in EPOR morphants. A. Normalization of apoptotic cell number (white arrows) and pronephros structure in EPO morphants, but not in EPOR morphants injected with hEPO at 24 hpf. Confocal images of TUNEL-stained TG(WT1B:EGFP) zebrafish embryos at 48 hpf were shown. Arrows labelled apoptotic cells in red; pronephros was labelled in green. White scale bar: 100 μm. B. Quantification of data for glomerulus (top) and pronephros (below) performed in three independent experiments. (n = 26–31 embryos per group). All data were analyzed using the Student's t-test. Mean ± s.e.m. ns not significant. *p < 0.05. **p < 0.01. ***p < 0.001. |
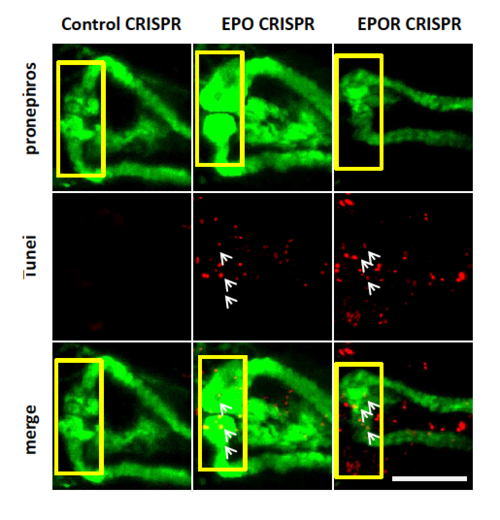
Increased apoptotic cell number (white arrows) and altered pronephros structure in EPO CRISPRants and EPOR CRISPRants as compared to Control CRISPRants. Confocal images of TUNEL-stained TG(WT1B:EGFP) zebrafish embryos at 48 hpf are shown. The yellow square highlighted glomerulus of zebrafish pronephros. White arrows labelled apoptotic cells shown in red color; pronephros was labelled in green. White scale bar: 100 μm. PHENOTYPE:
|