
- Title
-
Macrophage-Dependent Cytoplasmic Transfer during Melanoma Invasion In Vivo
- Authors
- Roh-Johnson, M., Shah, A.N., Stonick, J.A., Poudel, K.R., Kargl, J., Yang, G.H., di Martino, J., Hernandez, R.E., Gast, C.E., Zarour, L.R., Antoku, S., Houghton, A.M., Bravo-Cordero, J.J., Wong, M.H., Condeelis, J., Moens, C.B.
- Source
- Full text @ Dev. Cell
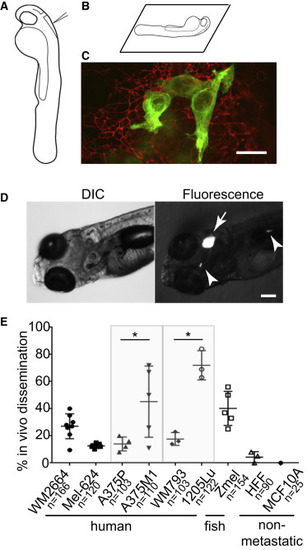
Human Melanoma Cells Disseminate from the Site of Transplantation (A and B) Schematic of zebrafish hindbrain ventricle transplantation and imaging strategy. (C) Confocal z projection of fixed larvae in which melanoma cells (GFP immunostaining, green) are dorsal to the choroid plexus, within the skin (ZO-1 immunostaining, red). Scale bar, 20 μm. See also Figure S1 and Movie S1. (D) Left: DIC image of anterior region of 6dpf zebrafish larva on left. Right: fluorescence image of same larva showing transplanted tumor (arrow) and disseminated cells (arrowheads). Scale bar, 100 μm. (E) Quantification of tumor cell dissemination in vivo in which each point is a single experiment comprising of 20–40 larvae. n indicates total number of zebrafish scored. Gray boxes indicate matched pairs of primary tumor-derived cell lines (A375P and WM793), and cell lines derived from metastases of those parental tumors (A375M1 and 1205Lu). Error bars are mean ± SD. One-way ANOVA (p < 0.0001), followed by non-parametric unpaired t test (p = 0.05 [between A375P and A375M1], p = 0.01 [between WM793 and 1205Lu]). Asterisks indicate p < 0.05. |
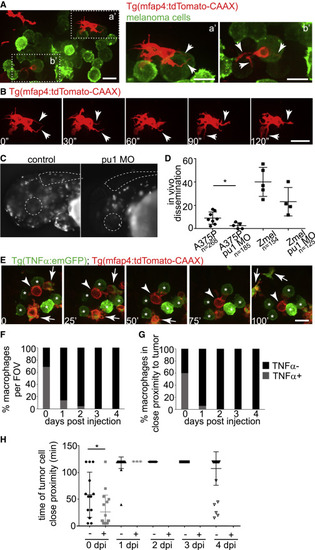
Macrophages in the Tumor Microenvironment Are Dynamic and in Close Proximity with Melanoma Cells In Vivo, and Are Predominantly TNF-α-Deficient Macrophages (A) Zebrafish macrophages labeled with Tg(mfap4:tdTomato-CAAX)xt6 (red) interact with human melanoma cells expressing LifeAct-eGFP (green). Two boxes outlined in left panel are magnified in the right boxes (a′, b′). Macrophage protrusions are in close proximity with tumor cells (arrows). (B) Still images from time-lapse video of macrophage in (a′), 30 s time interval, revealing dynamic protrusions (arrows). See also Figure S2; Movies S2, S3, and S4. (C) Images of macrophages labeled with Tg(mfap4:tdTomato-CAAX)xt6 in control and pu.1/spi1b MO-injected larvae. Larval eye and hindbrain are demarcated with dotted lines. See also Figure S3. (D) Percent dissemination of human melanoma cells (A375P) and zebrafish melanoma cells (Zmel) with and without pu.1/spi1b MO (30 pg). Each data point is an independent experiment, and n indicates number of total larvae. Error bars are mean ± SD. One-way ANOVA (p < 0.001), followed by unpaired non-parametric t test (p = 0.02). Asterisk indicates p < 0.05. (E) Still images of a time lapse of 0 day post tumor cell transplantation larvae. Macrophages express Tg(mfap4:tdTomato-CAAX)xt6 (red). Pro-inflammatory macrophages also express Tg(TNFα:emGFP)fh508. Melanoma cells (green only) are labeled with asterisks. Arrowhead marks a TNF-α– macrophage, and arrows mark TNF-α+ macrophages. See also Figure S4; Movie S5. (F) Quantification of TNF-α+ (gray) versus TNF-α– (black) macrophages in the tumor cell field of view 0–4 days post tumor cell injection (dpi). n = 5, 15, 11, 10, and 11 larvae for dpi 0–4, respectively. (G) Quantification of TNF-α+ (gray) versus TNF-α– (black) macrophages in close proximity with melanoma cells 0–4 dpi. n = 5, 15, 11, 10, and 11 larvae for dpi 0–4, respectively. (H) Quantification of time of macrophage/tumor cell contact in minutes (of a 120 min time lapse) for TNF-α+ versus TNF-α– macrophages (labeled “+” and “–” on the graph, respectively) on each day post injection. For 0 dpi, TNF-α+ (n = 18), TNF-α– (n = 13); 1 dpi, TNF-α+ (n = 3), TNF-α– (n = 56); 2 dpi, TNF-α– (n = 18); 3 dpi, TNF-α– (n = 17); 4 dpi, TNF-α– (n = 39). Time-lapse recordings were 120 min each. Error bars are mean ± SD. Asterisks indicate p < 0.05. Scale bar, 30 μM in all panels. Statistically significant difference between TNF-α– versus TNF-α+ tumor cell contact on 0 dpi, one-way ANOVA (p < 0.001), followed by unpaired non-parametric t test (p = 0.02). |
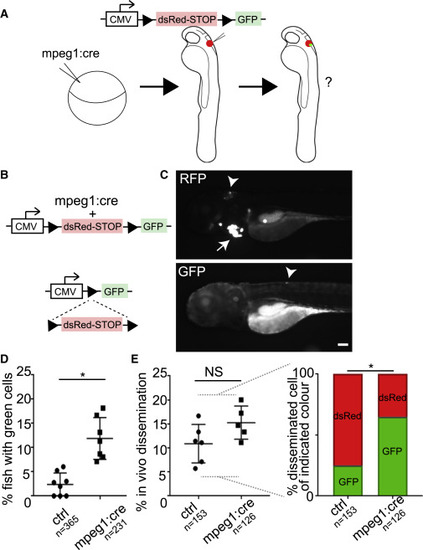
Macrophage Cytoplasmic Transfer to Melanoma Cells Correlates with Dissemination In Vivo (A and B) Strategy for Cre LoxP experiment, in which Cre is driven under a macrophage-specific promoter (mpeg1:Cre), and A375P human melanoma cells expressing CMV-LoxP-dsRed-STOP-LoxP-GFP are transplanted into transgenic larvae or control non-transgenics. Transfer of macrophage cytoplasm, including Cre recombinase, results in a switch in melanoma cell color from dsRed to GFP. (C) Lateral view of zebrafish larva with anterior to the left. Top panel shows RFP channel in which arrowhead points to tumor cell mass expressing dsRed. Red heart (arrow) indicates presence of mpeg1:Cre transgene. Bottom panel shows same larva in the GFP channel with single GFP+ disseminated tumor cell (arrowhead). Scale bar, 100 μm. (D) Quantification of the percent larvae with GFP+ tumor cells anywhere in the animal after transplantation into stable Tg(mpeg1:Cre)fh506 animals, compared with control non-transgenic animals. One-way ANOVA (p < 0.0001), followed by non-parametric unpaired t test, p = 0.003 (between ctrl and mpeg:cre). Error bars are mean ± SD. (E) Left side: quantification of percent larvae with any tumor cell dissemination (combining data for dsRed+ or GFP+) in stable Tg(mpeg1:Cre)fh506 animals, compared with control non-transgenic animals. Non-parametric unpaired t test, p = 0.10, not significant. Right side: ratio of disseminated tumor cells that are dsRed+ versus GFP+ in stable Tg(mpeg1:Cre)fh506 animals, compared with control non-transgenic animals. Non-parametric unpaired t test, p < 0.05 (between GFP+ cells in control and mpeg:cre). For (D) and (E), each data point is an independent experiment, n = number of larvae, and asterisks indicate p < 0.05. NS, not significant. Error bars are mean ± SD. See also Figure S5. |

Macrophage-Dependent Cytoplasmic Transfer Correlates with Melanoma Metastasis in Mammalian Models (A) Representative images of immunostained lung sections from control (top) and LysM Cre (bottom) mice injected with B16F10 expressing the LoxP cassette. Cells positive for MITF (melanoma cell marker) were scored as either GFP+ or dsRed+. Arrows indicate tumor cells. (B) Quantification of the ratio of metastasized tumor cells that were GFP+ or dsRed+. Each data point comprises an 8 μm section of lung tissue in control (three mice) and LysM Cre (three mice). Error bars are mean ± SD. Non-parametric unpaired t test, p = 0.001. Asterisk indicates p < 0.05. (C–E) Representative flow cytometry plots depicting metastasized MITF+ tumor cells (top panels) that are also GFP+ (bottom panels) in the lung of non-tumor-bearing mouse control (C), control non-Cre mice (D), and LysM Cre mice (E). Gating frequencies indicate average MITF+ percentage (top panels) and average GFP+ percentage of MITF+ cells (bottom panels) in control non-Cre mice (n = 2) and LysM Cre mice (n = 4) with the 95% confidence interval. |

Altering Macrophage Recruitment to the Tumor by Altering Myd88 Function Affects Tumor Cell Dissemination (A) Nucleotide alignment of vertebrate Myd88 sequences flanking conserved amino acid 265 (blue box), which is mutated to P to make a constitutively active form of the protein. (B) Macrophages (red) marked by Tg(mpeg1:tdTomato)w201 infiltrating the xenotransplanted tumor cells (green) in control (left, n = 5 experiments), myd88w187 mutant (middle, n = 7 experiments), and Tg(mpeg:myd88-L265P)fh507 transgenic larva (right, n = 4 experiments). Scale bars, 30 μm. (C and D) Quantification of macrophage infiltrate (C) and in vivo dissemination (D) after xenotransplantation into control, myd88w187 mutant, and Tg(mpeg:myd88-L265P)fh507 transgenic larva. (C) One-way ANOVA (p < 0.0001), followed by non-parametric unpaired t test (p < 0.05 [between ctrl and myd88w187], p < 0.05 [between ctrl and myd88-L265P]). Each data point is a larva. Error bars are mean ± SD. (D) One-way ANOVA (p < 0.0001), followed by non-parametric unpaired t test (p = 0.04 [between ctrl and myd88w187], p = 0.01 [between ctrl and myd88-L265P]). Error bars are mean ± SD. For (C) and (D), asterisks indicate p < 0.05. (E) Quantification of the percent larvae with GFP+ disseminated tumor cells after transplantation into mosaically expressing mpeg1:Cre animals in a control, myd88w187 mutant, or Tg(mpeg:myd88-L265P)fh507 background. One-way ANOVA (p < 0.0001), followed by non-parametric unpaired t test, p < 0.05 (between ctrl and myd88-L265P). Error bars are mean ± SD. For (D) and (E), each data point is an independent experiment and n = number of larvae. Asterisk indicates p < 0.05. (F) Each data point represents the number of macrophages in a tectum of a larva, as determined by single time point z stacks (80 μm) in the tectum. One-way ANOVA, p = 0.8, not significant. |

Macrophage Contact Precedes Cytoplasmic Transfer to Tumor Cells at the Injected Site (A) Quantification of larvae with disseminated GFP+ tumor cells that also had GFP+ tumor cells at the transplantation site 3 days prior. Number of larvae indicated in bar graph. (B) Quantification of larvae with GFP+ tumor cells at transplantation site that resulted in a disseminated GFP+, disseminated dsRed+, or no dissemination in control versus Tg(mpeg1:Cre)fh506 animals. Number of larvae indicated in bar graph. p < 0.0001, chi-square test. (C) Example of a GFP+ tumor cell at the site of transplantation at 1 dpi (left). Tumor cell is also positive in the red channel because all tumor cells were labeled with an additional red dye to better detect metastasis. Extra green fluorescence due to autofluorescence of the skin (asterisks). Right images show disseminated GFP+ tumor cell in the same larva at 4 dpi. Arrows indicate tumor cell. Inset shows zoomed region of the disseminated tumor cell. Scale bar, 30 μm. (D) Still images of a time-lapse recording of melanoma cells expressing CMV-LoxP-dsRed-STOP-LoxP-GFP (round, red cells) interacting with Tg(mfap4:tdTomato-CAAX)xt6-expressing macrophages (spindly, membrane-bound red cells, asterisks). Images are every 1 hr. Arrow marks a melanoma cell that begins to express GFP after macrophage contact. Scale bar, 30 μm. See also Movie S6. |

Macrophages Transfer Cytoplasm upon Cell Contact with Tumor Cells In Vitro (A) Still images from a movie showing primary macrophages (green) transferring GFP to MC-38 tumor cells (red nucleus, H2B-RFP) via a long tether. (B) Still images from a movie showing primary macrophages (green) transferring GFP to MC-38 tumor cells (red nucleus, H2B-RFP) upon close contact, in which, after the tumor cell divides, one of the daughter cells is obscured by the macrophage, leaving the other tumor cell with macrophage cytoplasm. Time indicated in minutes, and the arrows follow the tumor cell. Arrowhead at 255′ in (A) points to a macrophage which has lost GFP expression concomitant with gain of GFP expression in tumor cell. (C) Cell tracking of tumor cells before (left) and after (right) macrophage cytoplasmic transfer. Each cell is color coded in shades of gray. (D) Cell tracking of tumor cells before (left) and after (right) macrophage cell contact but no macrophage cytoplasmic transfer. Each cell is color coded in shades of gray. (E) Directionality measurements for tumor cells before and after macrophage cytoplasmic transfer in which the ratio of displacement length (dotted gray line) over total distance traveled (solid black lines) was measured and plotted. High ratios indicate high directionality. Error bars are mean ± SD. Non-parametric unpaired t test, p = 0.01 for before and after transfer. Asterisk indicates p < 0.05. NS, not significant. See also Figure S6; Movie S7. |

ZFIN is incorporating published figure images and captions as part of an ongoing project. Figures from some publications have not yet been curated, or are not available for display because of copyright restrictions. PHENOTYPE:
|
Reprinted from Developmental Cell, 43, Roh-Johnson, M., Shah, A.N., Stonick, J.A., Poudel, K.R., Kargl, J., Yang, G.H., di Martino, J., Hernandez, R.E., Gast, C.E., Zarour, L.R., Antoku, S., Houghton, A.M., Bravo-Cordero, J.J., Wong, M.H., Condeelis, J., Moens, C.B., Macrophage-Dependent Cytoplasmic Transfer during Melanoma Invasion In Vivo, 549-562.e6, Copyright (2017) with permission from Elsevier. Full text @ Dev. Cell