
- Title
-
Embryonic Ethanol Exposure Affects Early- and Late-Added Cardiac Precursors and Produces Long-Lasting Heart Chamber Defects in Zebrafish
- Authors
- Sarmah, S., Marrs, J.A.
- Source
- Full text @ Toxics
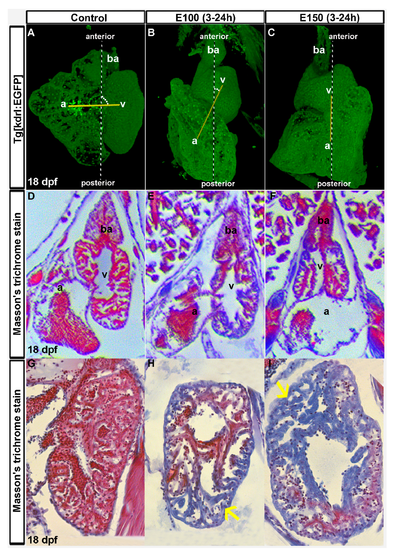
Ethanol-induced cardiac chamber defects occurring during embryogenesis persisted in older zebrafish larvae. (A–C) 3D renderings of confocal sections of Tg(kdrl:EGFP) show closely attached atrium and ventricle residing side by side in the control larva (A); ventricles are on the top of the atria in ethanol-exposed larvae (B,C); Dotted yellow line represents the line through AV valves connecting atrium and ventricle. The angle between yellow line and antero-posterior axis is shown by white dots; (D–F) Masson’s trichrome stained histology sections at the atrioventricular canal region showing both atrium and ventricle revealed defective anatomy of the ethanol-exposed larvae (E,F) compared to control (D); (G–I) Masson’s trichrome stained histology sections of the ventricle showed healthy looking cardiac muscle (red colored trabeculae) in control larva (G); and myocardial damage (blue colored trabeculae, yellow arrows) in ethanol-exposed larvae (H,I). EXPRESSION / LABELING:
PHENOTYPE:
|
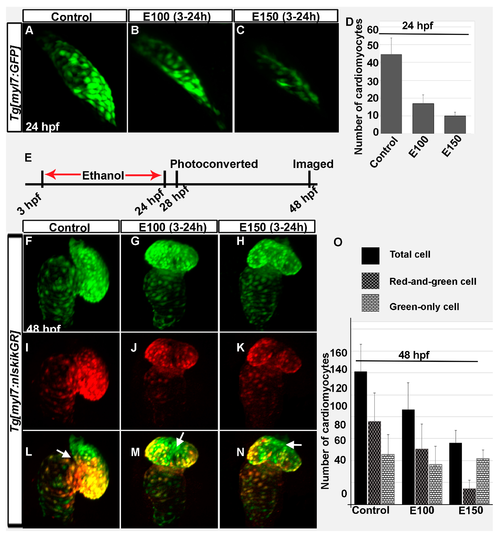
Ethanol exposure during embryogenesis reduced the number of early- and late-added cardiomyocytes in the heart. (A–C) 3D renderings of confocal sections of Tg(myl7:GFP) embryos showed GFP positive FHF derived cardiomyocytes in the linear heart tube in the control (A) and ethanol-exposed embryos (B,C); (D) Graph shows reduced number of FHF derived cardiomyocytes in ethanol-exposed embryos at 24 hpf. p < 0.001; (E) Schematic shows the time of ethanol treatment, photoconversion, and image acquisition in this experiment; (F–N) 3D renderings of confocal sections of photoconverted Tg(myl7:nlskikGR) embryos showed hearts in the control and ethanol-treated embryos. Note the green-only cardiomyocytes (cardiomyocytes added after photoconversion) in the anterior region of the ventricle in control embryos (A,L); but in the mid-ventricular region in ethanol-treated embryos (G–N); White arrows: green-only cells; (O) Graph shows the quantification of total, red-and-green (early-added cardiomyocytes) and green-only (late-added cardiomyocytes) cardiomyocytes at 48 hpf. |

Myocardial differentiation was delayed in ethanol-exposed embryos. (A–C) In situ hybridization detecting nkx2.5 expression showed weak nkx2.5 expression in the linear heart tube (indicated fewer undifferentiated FHF derived cells) but strong expression at the outflow pole (indicated arrival of second heart field (SHF) progenitors) in the control embryo (A); E100 embryos displayed strong nkx2.5 expression in the linear heart tube but no expression at the outflow pole (B); E150 embryos showed strong nkx2.5 expression in the linear heart tube and at the outflow pole (C); (D–F) Strong MF20 antibody staining in the linear heart tube in control embryos labeled differentiated cardiomyocytes (D); MF 20 staining was weaker in the heart tube in ethanol-treated embryos (E,F); (G–I) Co-labeled images showed myocardial differentiation delay in ethanol-exposed embryos. White arrows: pointing to the outflow pole. |
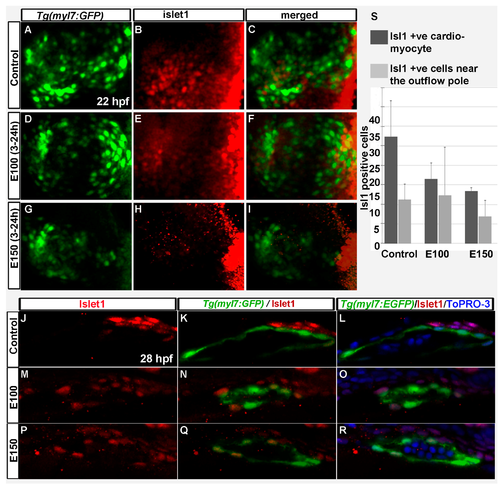
Embryonic ethanol exposure reduced second heart field precursors. (A–I) Anti-Islet1 antibody stained Tg(myl7:GFP) embryos showed Islet1 positive second heart field precursors in the rotating heart cone in control embryos (A–C) at 22 hpf; ethanol exposed embryos showed reduced number of Islet1 positive cells in the heart cones (D–I) at 22 hpf; (J–R) Anti-Islet1 antibody stained Tg(myl7:GFP) embryos showed second heart field derived cardiomyoctes in the heart (Myl7 and Islet1 double positive; red and green) and second heart field precursors (Islet1 positive, red) near the out flow pole in the control embryos (J–L) and ethanol-exposed embryos (M–R) at 28 hpf; (S) Graph shows the quantification of the Islet1/Myl7 double positive cardiomyocytes in the heart tube and Islet1 positive cells near the outflow pole at 28 hpf. EXPRESSION / LABELING:
|
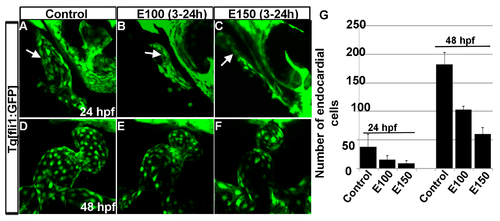
Ethanol exposure reduced endocardial cell numbers. (A–C) Tg(fli1:EGFP) embryos showed endocardial lining in the linear heart tube in control embryo (A) and in ethanol-exposed embryos (B,C) at 24 hpf; (D–F) Tg(fli1:EGFP) embryos showed normal-shaped endocardium in the control embryo (D) and deformed endocardium with fewer endocardial cells in ethanol-exposed embryos at 48 hpf (E,F); (G) Graph shows the quantification of the endocardial cells at 24 and 48 hpf. White arrow: endocardial lining. |