
- Title
-
Anisotropic Müller glial scaffolding supports a multiplex lattice mosaic of photoreceptors in zebrafish retina
- Authors
- Nagashima, M., Hadidjojo, J., Barthel, L.K., Lubensky, D.K., Raymond, P.A.
- Source
- Full text @ Neural Dev.

Emergence of the photoreceptor lattice mosaic in rapidly growing juvenile zebrafish. (A) Retinal flat-mount immunolabeled for ZO1. (B) Same as panel A, with cone profiles colored per spectral identity (UV cones in magenta); rods in black. Cone columns (dashed yellow line); rows of UV-Blue cones (dashed white line). (C) Live imaging, early larval Tg(sws2:mCherry; ruby) zebrafish eye, Blue cone-specific reporter (blue) viewed from the dorsal side, cornea to the right; spherical lens. Inset: Blue cone rows (white dashed line) orthogonal to, and columns (yellow dashed line) parallel to, the retinal margin. (D) Flat-mount retina; ring of EdU-labeled cells (asterisks) parallel to the retinal margin; cells added in the 10-day interval after the EdU pulse (bracket). D,Dorsal; N, Nasal; T, Temporal; V, Ventral. (E) Columns of cones added per day by retinal quadrant. Mean ± 1 s.d., n = 3. (F) Retinal surface area as a function of age. Mean ± 1 s.d., n = 4–6 for each age. (G) Flat-mount preparation of retinal margin and overlying retinal pigmented epithelium (RPE) in a juvenile zebrafish (maximum intensity z-projection of ZO1, in green). (See also Additional file 2: Figure S1 and Additional file 3: Movie S1.) (G’-G”) High magnification of boxes in G. Mitotic marker, pH3 (magenta; overlay in G”’, right panel). In the differentiating zone, immature photoreceptors have rounded profiles (dots) and Müller glial apical profiles are irregular polygonal shapes (asterisks). RPE cells (dashed line) in a separate, closely apposed epithelium (see Additional file 2: Figure S1B and Additional file 3: Movie S1). Scale bars: 10 μm (A, B, G, G”’); 100 μm (C); 200 μm (E); 5 μm (G’, G”) |

Spatial arrangement of cones is already patterned in the differentiating pre-column zone. (A-C) Retinal cross-section, juvenile zebrafish, Tg(trβ2: tdTomato) (red). Nuclei stained with Hoechst (gray). (A, A’) Proliferating retinal progenitors in the germinal zone (asterisks) and differentiated retina to the left: ganglion cell layer (gcl), inner nuclear layer (inl), and outer nuclear layer (onl). Immature, post-mitotic tdTomato+ Red cones (arrow) in the photoreceptor layer (onl) adjacent to Red cone progenitors (bracket) at the apical surface. (B, B’) Mitotic tdTomato+ progenitor (grey). (C, C’) Most peripheral tdTomato+ cells migrate basally toward inner retina (arrows). (D-D”’) Live-imaging 3D reconstruction of dorsal retinal margin of a trβ2: tdTomato (red);crx: mCFP (cyan);ruby juvenile fish. (See Additional file 4: Movie S2 for complete z-stack series.) (D) Single z-level focal plane (blue box); xy-crosshair is on tdTomato+ cell located in the proliferative germinal zone. (See also Additional file 4: Movie S2, white asterisks.) The flanking panels are slice views of the 3D reconstruction in the yz plane (red box), perpendicular to the retinal margin and the xz plane (green box), planar view of the retinal surface. (D’) Single, deeper z-level focal plane; xy-crosshair on a tdTomato+ immature Red cone in first cone column. In the yz plane (red box), axonal processes of immature cones separate the onl and inl (cyan, arrow). In the xz plane (green box), the xz -crosshair is on a Red cone in the first column. (D”) Higher magnification view in the xy plane of the first cone column (arrow); rounded, immature cone profiles (white dots). (See also Additional file 4: Movie S2.) (D”’) Higher magnification view in the xz plane of Red cones in first column (xz-crosshair) incorporated into the hexagonal pattern of the mature mosaic. (E-E”) Retinal flat-mount of a Tg(trβ2: tdTomato) fish (red) with anti-ZO1 (green). (E) Maximum intensity z-projection of ZO1 (green). (E’) Single z- focal plane at ZO1 level of trβ2:tdTomato label in the pre-column zone. Large immature UV cone profiles (white dots in the inset) centered in Red cone hexagons. (E”) Merged image. Scale bars: 20 μm (A’); 5 μm (B’); 10 μm (C’, D”, D”’, E”) |
Spatial patterning of cones precedes planar polarized Crumbs localization. (A-A”) Retinal margin in a flat-mount preparation, immunolabeled for Crb2b (magenta) and ZO1 (green). (A) Single z-level focal plane of the Crb2b channel at the level of ZO1 staining (OLM) in the pre-column zone. Crb2b ‘ladders’ (arrow) in the pre-column zone and adjacent columns. (Note that due to curvature of the retinal surface, the equivalent ZO1 level in the central retina at the left is at a deeper focal plane.) Immature UV cone profiles (white dots) in the pre-column zone. (A’) The maximum intensity z-projection of ZO1 labeling. (A”) Merged image. (B-B”) Retinal margin in a flat-mount preparation, immunolabeled for Crb2a (magenta) with the trβ2: tdTomato (green) Red cone marker. (B) Note small rings of strong Crb2a staining between cone columns (inset, arrows). (B’, B”) The intensely-labeled Crb2a+ rings are not co-labeled with trβ2: tdTomato. (C-C”) Immunoreactivity for Crb2a (magenta) with the rh1: EGFP (green) rod marker. (C’, C”) The strongly immunoreactive Crb2a+ rings surround rh1: EGFP+ labeled rod photoreceptors. Scale bars: 10 μm (A”, B”, C”) |

Parallel bands of Müller glial scaffolding appear simultaneously with differentiating cones. (A-D) Live imaging of the retinal margin, with Red cone trβ2:tdTomato (red) and Müller glial gfap:EGFP (green) markers. Glial processes completely surround cone and rod photoreceptors, which can be visualized as round ‘holes’ in the GFP label at the level of the OLM. (A-A”) Maximum intensity z-projection. Red cones in the patterned lattice mosaic (white dots) and pre-column zone (magenta dots). (A”) Red cones (white dots) and non-red cones (open white dots) in the patterned lattice mosaic. (Also see Additional file 9: Movies S3 and Additional file 10: Movie S4.) (B-D) Single z-levels focused on the pre-column (B), and patterned (C, D) areas. (E-E”’) Ridge analysis applied to Müller glial profiles in flat-mount of Tg(gfap: EGFP) (green) retina immunolabeled for ZO1 (magenta). (Also see Additional file 7: Figure S4.) Arrows (E-E”) indicate the location of the first ordered column of cone photoreceptors that can be clearly discerned from cell outlines at the level of the OLM (E’). Parallel ridges of Müller glia extend for several iterations into the pre-column zone (E’-E”’). Scale bar: 5 μm (D”) |

N-cadherin is associated with actomyosin mechanical forces in differentiating cones in the pre-column zone and with Müller glia inter-column bands in the mature mosaic. (A-A”) Flat-mount of retinal margin, immunolabeled for ZO1 (magenta) and N-Cadherin (green). (B-B”’) Higher magnification of pre-column zone (boxes in A-A”). N-Cadherin labeling surrounds round cone profiles and is concentrated in adherens junction puncta (arrows) outside photoreceptor profiles. Immature rods are outlined by ZO-1 (B’, B”, yellow dots) but are negative for N-cadherin (B”). Large round profiles represent immature UV cones (B’, white dot). (C-C”) Flat-mount of retinal margin, immunolabeled for phospho-Myosin light chain II (magenta) and pan-Cadherin (green). (D-D”) Higher magnification of pre-column zone (yellow box); strong pMyoII and pan-Cadherin staining of round profiles of differentiating cones. (E-E”) Higher magnification of mature lattice mosaic (white box); pMyoII and pan-Cadherin co-localize to puncta between cone columns (arrows). Scale bar: 10 μm (A” and C”) |

Müller glia mediate anisotropic mechanical forces in the retinal epithelium. (A-A”) Live imaging time course of targeted Müller glial ablations in Tg(gfap: EGFP; trβ2: tdTomato;ruby) juvenile zebrafish with glial (green) and Red cone (red) reporters. Photoreceptor profiles tracked for strain analysis (white dots). (A’-A”’) Targeted ablation of Müller glia introduces a hole in the sheet of Müller glial processes at the OLM. (Also see Additional file 12: Figure S7.) Relaxation of surrounding retinal epithelium at 9 min (A’), 27 min (A”), and 54 min (A”’) after ablation. (Also see Additional file 13: Movie S5.) (B-B’) trβ2: tdTomato+ Red cones survive after Müller glial ablation. (C-D) Schematic of pre (C) and post (D) ablation. Cones tracked for strain analysis (x). (E-F) Mechanical strain perpendicular (x-strain, E) and parallel (y-strain, F) to the retinal margin after ablation. Strains greater and smaller than 1 represent stretching and compression, respectively. Each retina is represented by a different shaped symbol (n = 6 controls; n = 8 experimental). Horizontal axis is the time interval between the ablation and the middle of the post-ablation imaging scan; two or three post-ablation scans were collected for each retina. Scale bars: 5 μm (A”’ and B’) |

A model for how the multiplex photoreceptor lattice mosaic is patterned by anisotropic tension, glial scaffolding, and planar polarized cell adhesion. Retinal margin in a lateral and b planar views with expression and localization of cell-cell adhesion complexes (N-cadherin, Crb2b, and ZO-1) as photoreceptors and Müller glia progress from proliferating progenitors (right) to differentiating cells in the pre-column zone (center) to the fully patterned, mature cone lattice mosaic (left). Cones (red, green, blue with UV represented by magenta); rods (small black dots); Müller glia (bright yellow); retinal precursors (light yellow). See Discussion for additional details |

Maximum intensity z-projection and lateral slice view of retinal margin illustrating shape and position of mitotic figures. (A) Snap shot from a 3D reconstruction of the retinal margin and retinal pigmented epithelium (RPE) in a flat-mount preparation immunostained for ZO1 (green). The front of the eye is to the right. Proliferative, differentiating (pre-column), and differentiated (mature mosaic) zones of the retina are labeled. (B-B”) Lateral view (xz plane) of ZO1 (green) and the mitotic marker, pH3 (magenta). (B) The RPE (arrow) and neural retinal epithelium (arrowhead) are separate but closely apposed, especially in the proliferative zone. (B’) The pH3+ mitotic cells are tilted with respect to the surface of the retinal epithelium, and the resultant parallax precludes identifying the profiles of pH3+ mitotic cells in the ZO1 channel in a maximum intensity z-projection (e.g., Fig. 1G'). (B’’) Proliferating endothelial cells in the circumferential blood vessel (yellow arrow) of the vitreous circulation, which lies below the retinal germinal zone [1], are also pH3+ (asterisks). Scale bar: 20 μm (A). |
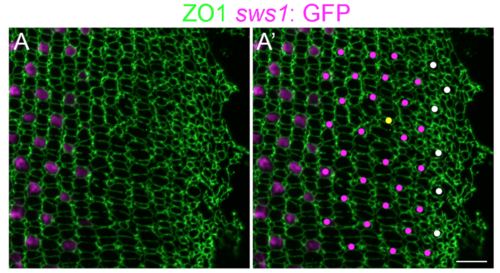
Immature UV cones have rounded apical profiles in the pre-column area. (A, A’) Retinal flat-mount immunocytochemistry for ZO1 (green) in a juvenile transgenic zebrafish with the UV cone reporter, Tg(sws1: EGFP) (magenta). The onset of sws1 opsin transgene expression is delayed in the differentiating UV cones until after the organization of cone columns. (A’) The precision of the mosaic pattern allows profiles that are Tg(sws1: EGFP)-negative to be identified as UV cones (magenta dots), and the position and shape of the large rounded profiles in the pre-column zone (white dots) suggests that these, too, are differentiating UV cones. Note the appearance of a new row and column (yellow dot) in this region, a pattern defect called a ‘Y-junction’ [1], which is analogous to an edge dislocation in crystals grown on curved surfaces and is required to accommodate the increased perimeter with continued retinal growth. Scale bar: 10 μm. |

Segmentation and classification of photoreceptor profiles. Selective projection of ZO1-labled cell profiles (A, A’’) and trb2:tdTomato+ Red cones (A’, A’’) in the pre-column zone of a retinal flat-mount. Panel A’’’ shows the tdTomato signal intensity at the level of the segmented ZO-1-labeled cell profiles, which was used for the automated classification and counting procedure described in the Materials and Methods. |
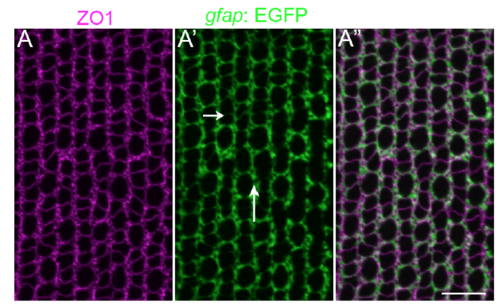
Müller glial apical processes are preferentially distributed into parallel, inter-column bands. (A-A”) Retinal flat-mount immunocytochemistry for ZO1 (magenta) in the Müller glial transgenic reporter line, Tg(gfap: EGFP). Müller glial processes (GFP+) completely surround the profiles of individual rods and cones, forming relatively thin intracolumn lamellae (short arrow), and thicker inter-column expansions (long arrow). Refer to Fig 1 A and B for a description of columns. Scale bar: 10 μm. |

Expression of cdh2 transcripts in differentiating photoreceptors (A-A’’’) In situ hybridization for cdh2 transcripts (A, white or A’’, A’’’, magenta) in a retinal cross-section from the Müller glial reporter line, Tg(gfap:EGFP) (A’-A’’’, green). In situ hybridization was performed as previously described [1]. In brief, after rehydration and proteinase K treatment, retinal cross-sections were incubated with digoxigenin-labeled RNA probes for cdh2 in Hauptmann’s hybridization solution at 65C overnight. Sections were then washed, treated with alkaline phosphatase conjugated anti-digoxigenin antibody (Roche, Basel, Switzerland), and blocked with Maleate Blocking solution. The signal was detected with Fast Red (Roche, Basel, Switzerland). Proliferating progenitors in the germinal zone (on the right), immature cone photoreceptors (arrow), and mature Müller glia (arrowheads) in the inner nuclear layer all express cdh2 transcripts. Mature photoreceptors in the outer nuclear layer of the mature, differentiated retina (to the left) do not express cdh2. ONL, outer nuclear layer; INL, inner nuclear layer. Scale bar: 10 μm. |
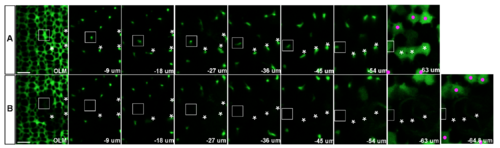
3D reconstruction demonstrates complete ablation of targeted Müller glia near the retinal margin. Confocal z-stack series of Tg(gfap: EGFP)-labeled Müller glial processes from the level of the outer limiting membrane (OLM) to the cell body before (A) and 9 minutes after laser ablation (B). Multi-photon laser ablation targeted the radial processes at a depth of 25-50 μm, between the OLM and the level of the cell bodies (~63 μm below the OLM in this example). Three targeted Müller glial cell bodies and radial processes are indicated by asterisks. (B) Multi-photon laser ablation targeting the radial glial process at a single z-level successfully destroyed the cell body and ascending processes of Müller glia (asterisks) and created a hole in the sheet of Müller glial processes at the level of OLM. The surrounding Müller glia remained intact (magenta dots), except for one cell close to the cluster of three targeted cells, which disappeared after the ablation (rectangle). The slight difference in the relative distance from OLM to the cell bodies of surviving Müller glia before and after ablation (-63 μm and -64.8 μm, respectively) is consistent with a previous report that radial processes of Müller glial in embryonic zebrafish retinas function like a spring, providing tension in the plane perpendicular to the apical surface [1]. Scale bar: 5 μm (A, B). |