
- Title
-
Live imaging molecular changes in junctional tension upon VE-cadherin in zebrafish
- Authors
- Lagendijk, A.K., Gomez, G.A., Baek, S., Hesselson, D., Hughes, W.E., Paterson, S., Conway, D.E., Belting, H.G., Affolter, M., Smith, K.A., Schwartz, M.A., Yap, A.S., Hogan, B.M.
- Source
- Full text @ Nat. Commun.

VE-cadherin-TS is localized to cell-cell junctions and reports a differential FRET signature. a Schematic representation of the tension sensor (TS) module. The Donor fluorescent protein, Teal, is separated from the acceptor, Venus, by a stretchable linker peptide (top). When the module is under tension (bottom), energy transfer from Teal to Venus will decrease. b Schematic of zebrafish VE-cadherin-TS cDNA recombined into the ve-cadherin BAC clone. c Venus expression from Tg(ve-cad:ve-cadTS) throughout the blood vasculature at 2 dpf. Scale bar = 150 μm. d Maximum projection of the dorsal aorta (DA) at 3 dpf showing expression of Teal (top) and Venus (bottom) localized at cell–cell junctions. Scale bar = 10 μm. e Co-expression (Merge, bottom) of Venus (yellow, top) from Tg(ve-cad:ve-cadTS) and Tg(fli1ep:lifeact-mCherry), labeling F-actin (purple, middle), in endothelial junctions at 3 dpf. Scale bar = 5 μm. f–g Fluorescence intensity of Venus (f) and Tg(fli1ep:lifeact-mCherry), labeling F-actin (g), along a single 3 μm line-region in a single Z-section (shown in e). h RAW FRET signal at endothelial junctions at 2 dpf. Scale bar = 5 μm. i Ratio-metric FRET signal at 2 dpf in endothelial junctions (shown in h). Scale bar = 5 μm. j Variable ratio-metric FRET values along a single 10 μm line-region in a single Z-section in a proportion of the junction (boxed in i) |
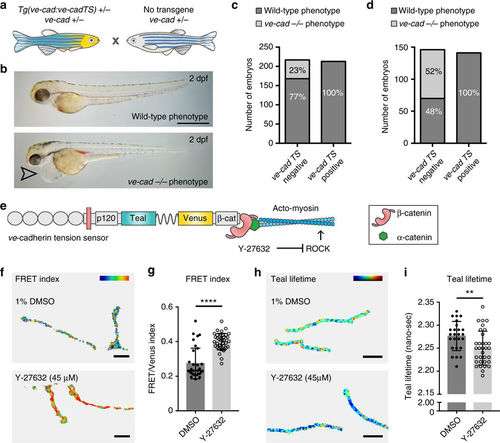
VE-cadherin-TS is functional and under acto-myosin controlled tension. a Schematic representation of genetic cross to test functionality of VE-cadherin-TS. b Wild-type (top) and ve-cadherin mutant (bottom) phenotype at 2 dpf (arrowhead indicates cardiac oedema in mutant). Scale bar = 1 mm. c Phenotypic scoring all embryos (n = 430) collected from cross in a, showing 23% phenotypic mutants (n = 49/217) in TS-negative population (n = 217) and 0% (n = 0/213) in TS-positive siblings (n = 213). d Phenotypic scoring of n = 286 embryos from a cross between a Tg(ve-cad:ve-cadTS)+/−, cdh5 ubs8−/− mutant and a non-transgenic cdh5 ubs8+/− animal. In the TS negative population 52% (n = 76/146) displayed the mutant phenotype whilst there were no phenotypic mutants in the TS positive clutch (n = 141). e Schematic representation of Y-27632 (ROCK inhibitor) acto-myosin inhibition. f Heatmap image of ratio-metric FRET values in junctions of 1%DMSO and Y-27632 (45 μM/1%DMSO) treated embryos. Colors range from blue ( = low FRET index/high tension) to red ( = high FRET index/low tension). Scale bar = 5 μm. g Quantification of ratio-metric FRET values in junctions of 1 % DMSO (n = 4) versus Y-27632 (45 μM/1%DMSO) (n = 5) treated embryos. Each data point represents a junctional region of interest (ROI), n = 33 junctions selected from DMSO control embryos and n = 40 selected in Y-27632 treated embryos. Treatment for 5 h prior to imaging. Error bars represent mean ± s.d.; ****p < 0.0001 from unpaired two-sided Mann–Whitney test. h Heatmap image of Teal lifetime values in junctions of 1%DMSO (top) and Y-27632 (bottom, 45 μM/1%DMSO)- treated embryos. Colors range from blue ( = low lifetime/low tension) to red ( = high lifetime/high tension). Scale bar = 5μm. i Quantification of Teal lifetime values (nano-sec) in junctions of 1 % DMSO (n = 4) versus Y-27632 (45 μM/1%DMSO) (n = 4) treated embryos. Each data point represents a single junctional ROI, n = 25 junctions segmented from DMSO control embryos and n = 33 from Y-27632 treated embryos. Treatment for 5 h prior to imaging. Error bars represent mean ± s.d.; **p = 0.0060 from unpaired two-sided t test |
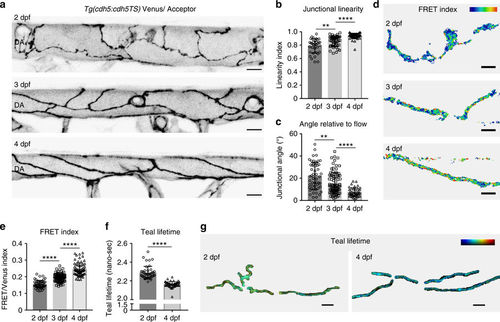
Cellular morphology and VE-cadherin tensile changes occur during artery maturation. a Junctional morphology of ECs in the dorsal aorta (DA) (Venus, grey) at 2 dpf (top), 3 dpf (middle) and 4 dpf (bottom). Scale bar = 10 μm. b Junctional linearity index over time at 2 dpf (n = 37 junctions from n = 4 embryos), 3 dpf (n = 37 junctions from n = 5 embryos) and 4 dpf (n = 51 junctions from n = 4). Error bars represent mean ± s.d.; 2–3 dpf **p = 0.0010; 3–4 dpf ****p < 0.0001, from unpaired two-sided Mann–Whitney test. c Junctional angle relative to the direction of blood flow over time at 2 dpf (n = 53 junctions from n = 4 embryos), 3 dpf (n = 89 junctions from n = 5 embryos) and 4 dpf (n = 42 junctions from n = 4). Error bars represent mean ± s.d.; 2–3 dpf **p = 0.0010; 3dpf– 4dpf ****p < 0.0001 from unpaired two-sided Mann–Whitney test. d Heatmap image of ratio-metric FRET values in junctions at 2 dpf (top), 3 dpf (middle) and 4 dpf (bottom). Colors range from blue ( = low FRET index/high tension) to red ( = high FRET index/low tension). Scale bar = 5 μm. e Quantification of ratio-metric FRET values in junctions at 2 dpf (n = 54 junctional ROIs from n = 4 embryos), 3 dpf (n = 79 junctional ROIs from n = 5 embryos) and 4 dpf (n = 71 junctional ROIs from n = 4 embryos). Error bars represent mean ± s.d.; 2–3 dpf ****p < 0.0001, from unpaired two-sided t test; 3–4 dpf ****p < 0.0001 from unpaired two-sided Mann–Whitney test. f Quantification of Teal lifetime values (nano-sec) comparing n = 43 junctional ROIs segmented from 2 dpf embryos (n = 8) and n = 54 junctional ROIs from 4 dpf embryos (n = 10). Error bars represent mean ± s.d.; ****p < 0.0001 from unpaired two-sided Mann–Whitney test. g Heatmap image of Teal lifetime values in junctions of 2 dpf (left) versus 4 dpf (right) embryos. Colors range from blue ( = low lifetime/low tension) to red ( = high lifetime/high tension). Scale bar = 5 μm |

Inhibiting Vegf signaling impairs linearisation and VE-cadherin tension changes during arterial maturation. (a, b) Junctional morphology of ECs in the DA (Venus, grey) in uic (top) and kdr/kdrl morphants (bottom) at 2 dpf (a) and 3 dpf (b). Scale bar = 10 μm. c Number of ECs quantified at 2 dpf (uic n = 9, kdr/kdrl MO n = 6 embryos) and 3 dpf (uic n = 10, kdr/kdrl MO n = 7 embryos). Error bars represent mean ± s.d.; 2 dpf uic–2 dpf kdr/kdrl MO ****p < 0.0001 from unpaired two-sided t test, 3 dpf uic–3 dpf kdr/kdrl MO **p = 0.0068 from unpaired two-sided Mann–Whitney test. d Junctional linearity index of junctions in uic and kdr/kdrl morphants at 2 dpf and 3 dpf. Error bars represent mean ± s.d.; 2dpf uic–3dpf uic ****p < 0.0001; 2 dpf kdr/kdrl MO–3dpf kdr/kdrl MO, p = 0.0862 from unpaired two-sided Mann–Whitney test. e, f Ratio-metric FRET values of uic and kdr/kdrl morphants at 2 dpf e (uic n = 74 junctional ROIs from n = 9 embryos, kdr/kdrl MO n = 86 junctional ROIs from n = 6 embryos) and 3 dpf f (uic n = 62 junctional ROIs from n = 10 embryos, kdr/kdrl MO n = 58 junctional ROIs from n = 7 embryos). Error bars represent mean ± s.d.; ***p = 0.0007; *p = 0.0391 from unpaired two-sided t test. g Ratio-metric FRET values from 1% DMSO controls (n = 48 junctional ROIs from n = 6 embryos) versus SL327 (4 μM/1% DMSO)-treated embryos (n = 66 junctional ROIs from n = 10 embryos). Treatment from 20 hpf to 3 dpf. Error bars represent mean ± s.d.; ****p < 0.0001 from unpaired two-sided t test. h Junctional linearity index in 1% DMSO treated controls (n = 32 junctional ROIs from n = 6 embryos) versus SL327 (4 μM/1% DMSO)-treated embryos (n = 56 junctional ROIs from n = 10 embryos). Error bars represent mean ± s.d.; **p = 0.0045 from unpaired two-sided Mann–Whitney test. i Junctional morphology of ECs in the DA (Venus, grey) at 3 dpf in 1% DMSO and SL327 (4 μM/1% DMSO) treated embryos at 3 dpf. Scale bar = 10 μm. j Ratio-metric FRET values from uic (n = 45 junctional ROIs from n = 8 embryos) versus kdr/kdrl morphants incubated in 1% DMSO as a control (n = 43 junctional ROIs from n = 9 embryos) and kdr/kdrl Y-27632-treated morphants (50 μM/1% DMSO, n = 40 junctional ROIs from n = 9 embryos) at 2 dpf. Error bars represent mean ± s.d.; uic–kdr/kdrlMO + DMSO ****p < 0.0001; kdr/kdrlMO + DMSO – kdr/kdrlMO + Y-27632 ***p = 0.0005 from unpaired two-sided t test |
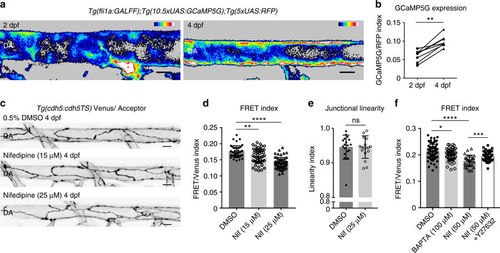
Calcium signaling maintains lower VE-cadherin tension during artery maturation. a Heatmap image showing average intensity projection of fli1a-driven GCaMP5G expression (indicating calcium) in the DA at 2 dpf (left) and 4 dpf (right). Colors range from black ( = low calcium) to white ( = high calcium). Scale bar = 10 μm. b Increase in fluorescence intensity index ( = fli1a driven GCaMP5G/ fli1a-driven RFP) in the dorsal wall of the DA of n = 9 embryos imaged at 2 and 4 dpf. **p = 0.0012, from paired t test. c Junctional morphology of ECs in the DA (Venus, grey) of a 0.5% DMSO, a 15 μM/0.5% DMSO Nifedipine and a 25 μM/0.5% DMSO Nifedipine treated embryo at 4 dpf. Treatment from 2 to 4 dpf. Scale bar = 10 μm. d Ratio-metric FRET values in junctions of 0.5% DMSO (n = 42 junctional ROIs from n = 5 embryos), 15 μM Nifedipine (n = 54 junctional ROIs from n = 6 embryos) and 25 μM Nifedipine (n = 59 junctional ROIs from n = 6 embryos) treated embryos. Treatment was from 2 to 4 dpf. Error bars represent mean ± s.d.; DMSO – 15 μM Nifedipine **p = 0.0068, DMSO – 25 μM Nifedipine ****p < 0.0001, from unpaired two-sided Mann–Whitney test.e Junctional linearity index in 0.5% DMSO treated controls (n = 5) versus 25 μM Nifedipine-treated embryos (n = 6). Each data point represents a junction, n = 18 control junctions measured and n = 18 junctions from Nifedipine-treated embryos. Error bars represent mean ± s.d.; not significant (ns) p = 0.8147, from unpaired two-sided Mann–Whitney test. f Ratio-metric FRET values quantified from 1% DMSO-treated controls (n = 39 junctional ROIs from n = 6 embryos), BAPTA-AM-treated (100 μM for 1 h, n = 58 junctional ROIs from n = 8 embryos), Nifedipine-treated (50 μM for 30 min, n = 27 junctional ROIs from n = 5 embryos) and Nifedipine + Y-27632-treated embryos (n = 47 junctional ROIs from n = 8 embryos). Error bars represent mean ± s.d.; 1% DMSO – 100 μM BAPTA-AM *p = 0.0498; 1% DMSO – 50 μM Nifedipine ****p < 0.0001; 50 μM Nifedipine - 50 μM Nifedipine + 50 μM Y-27632 ***p = 0.0008, from unpaired two-sided t test |
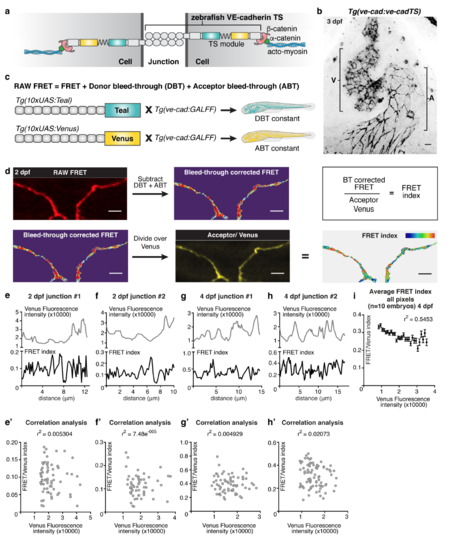
Controlled FRET quantification of VE-cadherin-TS expression (a) Schematic representation of VE-cadherin Tension Sensor (TS) proteins at a cell-cell junction and intra-cellular linkage to acto-myosin (blue) via β-catenin (red) and α-catenin (green). (b) Venus expression (grey) from Tg(ve-cad:ve-cadTS) in the endocardium of the heart at 3 dpf (A=atrial endocardium, V=ventricular endocardium). Scale bar = 10μm. (c) Schematic representation of Tg(10xUAS:Teal) and Tg(10xUAS:Venus) strains required to correct for Donor bleed through (DBT) and Acceptor bleed through (ABT). (d) Step-wise explanation of RAW FRET processing. From the intensity of each pixel in the RAW FRET image the value for DBT and ABT is subtracted, resulting in the bleed through (BT) corrected FRET. The BT-corrected FRET is subsequently divided by the intensity for Venus in each pixel to normalise for the amount of protein present. The final outcome is represented as a ratio-metric FRET. Scale bar = 5μm. (e-f’) Intensity plots of Venus fluorescence (grey, top) and FRET index (black, below) from spatially matched pixels within a line drawn across single junctions at 2 dpf (e-f) showing that these quantities to not follow the same profile. Correlation analysis of matched pixels within these junctions is depicted in e’ (r2=0.005305, p=0.5491) and f’ (r2=7.458e-005, p=0.9487). (g-h’) Intensity plots of Venus fluorescence (grey, top) and FRET index (black, below) from spatially matched pixels within a line drawn across single junctions at 4 dpf (g-h) showing that these quantities to not follow the same profile. Correlation analysis of matched pixels within these junctions is depicted in g’ (r2=0.004929, p=0.5694) and h’ (r2=0.02073, p=0.1941). (i) Grouped analysis of ratio-metric FRET values in all pixels within n=52 junctional ROIs selected from n=10 embryos at 4 dpf. Pixels were grouped based on increments of Venus intensity levels of 500. The mean FRET-index value and S.E.M of each Venus intensity group was calculated and plotted. Correlation analysis of mean Venus intensity and mean FRET index within each group (r2=0.5453, ****p<0.0001). |
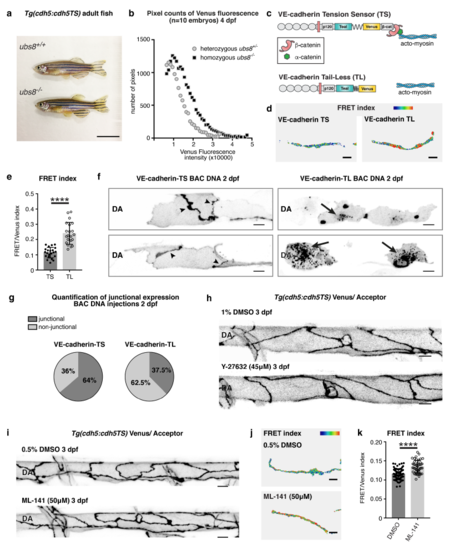
The amount of VE-cadherin at the junctions is tightly regulated and under acto-myosin dependent tension (a) Representative image a wild-type (ubs8+/+) Tg(ve-cad:ve-cadTS) animal (top) and a vecadherin mutant (ubs8-/-) Tg(ve-cad:ve-cadTS) animal showing that mutants are viable and morphologically indistinguishable from genotypic wild-type animals. Scale bar = 1 cm.(b) Quantification of the number of pixels within groups separated by increments of Venus intensity levels of 1000. Each data point is the number of pixels in each group. Pixels numbers are compared between heterozygous ubs8+/- (black, pixels in n=47 junctions selected from n=9 embryos) and homozygous ubs8-/- (grey, pixels in n=52 junctions selected from n=10 embryos) showing an improved detection range in the homozygous mutants. (c) Schematic representation of VE-cadherin-TS (top) and VE-cadherin-TL protein (bottom) which lacks the β-catenin binding domain (β-catenin=red, α-catenin=green, actomyosin= blue). (d) Heatmap image of ratio-metric FRET values in junctions expressing VE-cadherin-TS versus VE-cadherin-TL at 2 dpf. Colors range from blue (=low FRET index/high tension) to red (=high FRET index/low tension). Scale bar = 5μm. (e) Ratio-metric FRET values of VE-cadherin-TS (n=22 junctions from n=6 embryos) versus VE-cadherin-TL (n=21 junctions from n=6 embryos) at 2 dpf. Error bars represent mean ± s.d.; ****p<0.0001, from unpaired two-sided t-test. (f) Venus expression (grey) showing representative examples of junctional expression of VEcadherin- TS (left, black arrowheads) and aggregating VE-cadherin-TL expression (right, black arrowheads) in the DA upon DNA injections. Scale bar = 10μm. (g) Quantification of junctional versus non-junctional expression in cells expressing VEcadherin- TS (n=72 cells analysed) and VE-cadherin-TL (n=32 cells analysed) at 2 dpf. (h) Junctional morphology of ECs in the DA (Venus, grey) at 3 dpf in 1%DMSO and Y-27632 (45μM/1%DMSO) treated embryos. Scale bar = 10μm. (i) Junctional morphology of ECs in DA (Venus, grey) at 3 dpf in 0.5%DMSO and ML-141 (50μM/0.5%DMSO, Cdc42 inhibitor) treated embryos. Scale bar = 10μm. (j) Heatmap image of ratio-metric FRET values in junctions of 0.5%DMSO and ML-141 (50μM/0.5%DMSO) treated embryos at 3 dpf. Colors range from blue (=low FRET index/high tension) to red (=high FRET index/low tension). Scale bar = 5μm.(k) Ratio-metric FRET values in junctions from 0.5%DMSO treated controls (n=81 junctional ROIs from n=9 embryos) and ML-141 (50μM/0.5%DMSO) treated embryos (n=46 junctional ROIs from n=5 embryos) at 3 dpf. Error bars represent mean ± s.d.; DMSO – ML-141 ****p<0.0001, from unpaired two-sided t-test. |
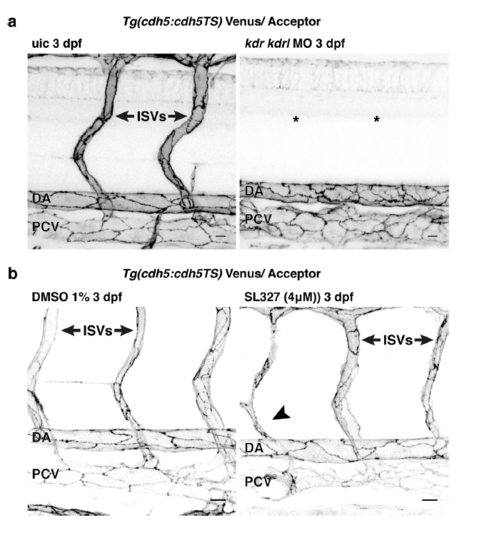
Gross phenotypes in kdr/kdrl morphant and SL327 treated embryos (a) Venus expression (grey) from Tg(ve-cad:ve-cadTS) in the trunk of an un-injected control (uic) and a kdr/kdrl MO injected embryo at 3 dpf showing a loss of intersegmental vessels (ISVs) in the morphant (asterisks). Scale bar = 10μm. (b) Venus expression (grey) at 3 dpf from Tg(ve-cad:ve-cadTS) in 1%DMSO treated control and SL327 (4μM/1%DMSO) treated embryos. Treatment from 20 hpf till 3 dpf. SL327 treatment results in only mild intersegmental vessel defects (compared to kdr/kdrl knockdown (a)) recognized by thin ISVs (black arrowhead). Scale bar = 10μm. |
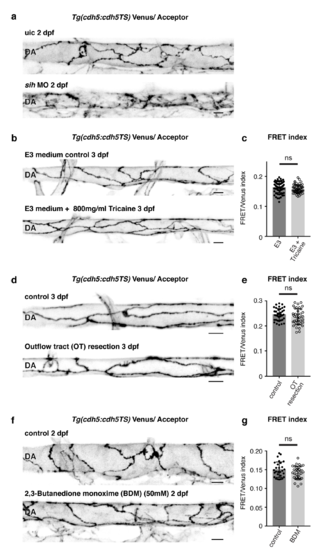
Acute loss of blood flow does not inflict immediate changes in tension across VE-cadherin (a) Junctional morphology of ECs in the DA (Venus, grey) of an uic and a sih MO injected embryo at 2 dpf showing that mature junctions fail to form without flow. Scale bar = 10μm. (b) Morphology of junctions in the DA (Venus, grey) of a control embryo and an embryo that has been incubated in a high dose of Tricaine (800mg/ml) to stop cardiac contraction and blood flow. Scale bar = 10μm. (c) Ratio-metric FRET values in junctions of control (n=68 junctional ROIs from n=10 embryos) versus Tricaine treated embryos control (n=56 junctional ROIs from n=10 embryos). Error bars represent mean ± s.d.; not significant (ns) p=0.0834, from unpaired two-sided ttest. (d) Venus expression (grey) showing junctional morphology of ECs in the DA at 3 dpf of a control embryo and an embryo that underwent surgical outflow tract resection to stop blood flow. Image taken 3 hours after surgery. Scale bar = 10μm. (e) Ratio-metric FRET quantifications from control embryos (n=39 junctional ROIs from n=8 embryos) and embryos in which the outflow tract was surgically disconnected (n=38 junctional ROIs from n=7 embryos). Error bars represent mean ± s.d.; not significant (ns) p=0.01472, from unpaired two-sided t-test. (f) Morphology of junctions in the DA (Venus, grey) of an untreated control versus a 2,3- butanedione monoxime (BDM, 50mM) treated embryo at 2 dpf. Scale bar = 10μm. (g) Ratio-metric FRET quantifications from junctions in untreated embryos (n=28 junctional ROIs from n=8 embryos) versus junctions in BDM (50mM) treated embryos (n=34 junctional ROIs from n=8 embryos) at 2 dpf. Error bars represent mean ± s.d.; not significant (ns) p=0.1039, from unpaired two-sided t-test. |