
- Title
-
Leucine repeat adaptor protein 1 interacts with Dishevelled to regulate gastrulation cell movements in zebrafish
- Authors
- Cheng, X.N., Shao, M., Li, J.T., Wang, Y.F., Qi, J., Xu, Z.G., Shi, D.L.
- Source
- Full text @ Nat. Commun.
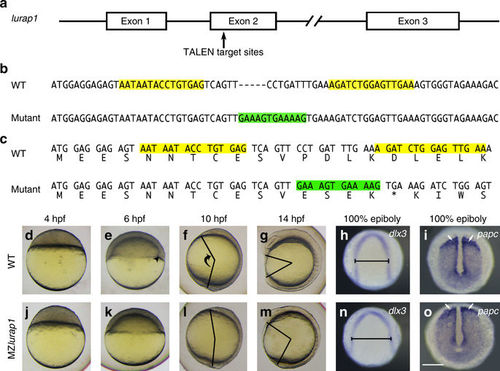
Mutation of lurap1 in zebrafish impairs CE movements. a Genomic organisation of lurap1 locus and TALEN-targeted regions. b Generation of an indel mutation in the second exon of lurap1 gene following a deletion of 7 nucleotides and an insertion of 12 nucleotides (green) between TALEN recognition sequences (yellow). Dashes are introduced in the WT sequence to optimise sequence alignment. c Frameshift and premature termination of translation in the lurap1 mutant transcript. d–g Live images of WT embryos at indicated stages, lateral view with animal pole or anterior region on the top. Arrowhead indicates the embryonic shield. The angle between the anterior end and posterior end, which reflects the extent of anteroposterior axis extension, is shown at 10 and 14 hpf. h, i Analysis by in situ hybridisation of dlx3 and papc expression patterns shows the extent of CE movements in WT embryos at 100% epiboly stage. j–m Phenotypes of MZlurap1 embryos at indicated stages show delayed embryonic shield formation and reduced anteroposterior axis elongation. n, o The expression patterns of dlx3 and papc in MZlurap1 embryos indicate defective CE movements. The neural plate is wider (horizontal line) and paraxial mesoderm is compressed (arrows). Scale bar: d–o 200 µm EXPRESSION / LABELING:
PHENOTYPE:
|
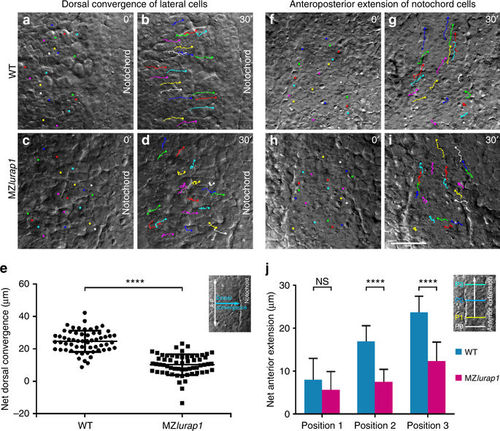
Live time-lapse analysis of cell movements in WT and MZlurap1 embryos. The initial and final positions of 20 randomly selected cells are labelled by coloured dots, and their movement trajectories are traced. Representative images selected from time-lapse movies are positioned with the anterior region on the top. a, b First and last images show the convergence of lateral cells towards the notochord in a WT embryo. c, d First and last images show the movement behaviours of lateral cells in a MZlurap1 embryo. e Scatter plot shows the net distance, represented by the horizontal arrow in the inset, reached by lateral cells towards the notochord during convergence in WT and MZlurap1 embryos. Bars represent the mean values ± s.d. from three independent experiments (****P < 0.0001; Student’s t-test). f, g First and last images show the anterior extension of notochord cells in a WT embryo. h, i First and last images show the movement behaviours of notochord cells in a MZlurap1 embryo. j Graph shows the net anterior extension, represented by the vertical arrow in the inset, reached by notochord cells located at three different anteroposterior positions, as represented by the coloured horizontal lines in the inset. Bars represent the mean values ± s.d. from three independent experiments (****P < 0.0001; NS, not significant; Student’s t-test). The three positions (P1, P2, and P3) are selected at the middle region of the anteroposterior length in both WT and MZlurap1 embryos, and located at a distance of 20, 50, and 80 µm anterior to the arbitrary reference position (P0), respectively. Scale bar: a–d, f–i 50 µm PHENOTYPE:
|
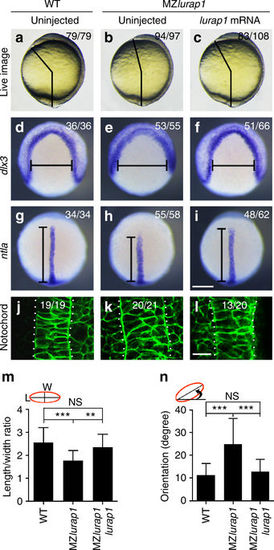
Lurap1 rescues MZlurap1 mutant phenotypes and notochord cell polarity. a–c Phenotype rescue is determined by measuring the angle between the anterior end and posterior end in indicated embryos. d–i Analysis by in situ hybridisation of dlx3 and ntla expression patterns shows the rescue of neural plate convergence (horizontal line) and notochord extension (vertical line) in MZlurap1 embryos. j–l Analysis by confocal microscopy shows the rescue of notochord width and cell shape in MZlurap1 embryos. m, n Graphs show rescue of the LWR and the orientation of notochord cells in MZlurap1 embryos. The data were calculated using a total of 135 cells from 9 embryos in each condition. Bars represent the mean values ± s.d. from three independent experiments (**P < 0.01; ***P < 0.001; NS, not significant; Student’s t-test). Scale bars: a–i 200 µm; j–l 20 µm |
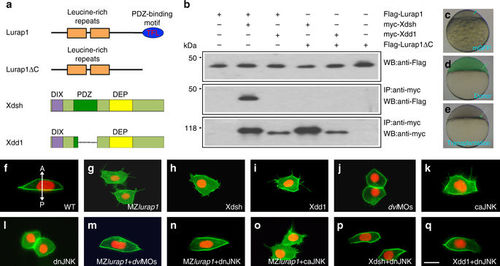
Lurap1 interacts with Dvl and JNK in cellular polarisation. a Schematic representation of Lurap1 and Dvl proteins. b Co-immunoprecipitation shows physical interaction between Lurap1 and Dvl. c–e Cell transplantation procedure for the analysis of cell polarity and protrusive activity. Labelled donors and unlabelled recipient embryos have either the same genotype, or they are injected with identical mRNAs or morpholinos. f–q Polarised behaviours and protrusive activities of transplanted cells integrated in the notochord of recipient embryos. The cell membrane is labelled by mGFP and the nucleus is labelled by Histone2B-RFP. The experiments were performed using at least three independent offspring, and a total of at least 10 embryos were analysed in each condition. Representative images are shown, with the anterior region positioned on the top. f A bipolar and mediolaterally elongated WT cell with unidirectional filopodia. The bidirectional arrow indicates anterior (A) and posterior (P) axis. g Multipolar protrusive MZlurap1 mutant cells are less elongated, with lamellipodia and filopodia in all directions. h A Xdsh-overexpressing cell loses polarity and forms multiple lamellipodia that also extend filopodia in random directions. i A Xdd1-overexpressing cell becomes multipolar protrusive, with extensive filopodia in all directions. j Knockdown of dvl2 and dvl3a in WT cells blocks protrusive activity, and morphant cells take a round shape. k Overexpression of caJNK in a WT cell disrupts polarised cell behaviours and induces multiple filopodia in random directions. l Blockade of JNK signalling in WT cells results in loss of protrusive activity and cell polarity. m–o The mediolateral polarity and protrusive activity of MZlurap1 mutant cells are rescued by reducing Dvl dosage or JNK activity, but not by increasing JNK activity. p, q Reducing JNK activity in Xdsh-overexpressing or Xdd1-overexpressing cells restores mediolateral polarity, and prevents the formation of randomised lamellipodia and filopodia. Scale bar: f–q 20 µm |
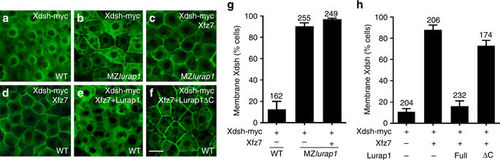
Lurap1 modulates Dvl membrane localisation. Analysis by confocal microscopy of myc-tagged Xdsh subcellular localisation in indicated conditions. a Xdsh is localised predominantly in the cytoplasm, and weakly at the plasma membrane in a WT embryo. b Enhanced Xdsh membrane localisation in the blastoderm cells of a MZlurap1 embryo. c Xfz7 further enhances Xdsh membrane localisation in a MZlurap1 embryo. d Xdsh membrane recruitment by Xfz7 in WT embryo. e Lurap1 prevents Xdsh membrane recruitment by Xfz7. f Lurap1ΔC has no effect on Xdsh membrane recruitment by Xfz7. g, h Graphs show the extent of Xdsh membrane localisation in different conditions. The cells with stronger or equal membrane than cytoplasmic Xdsh staining are counted. Numbers on the top of each bar indicate total cells examined from 6 to 8 embryos in three independent experiments. Scale bar: a–f 20 µm |
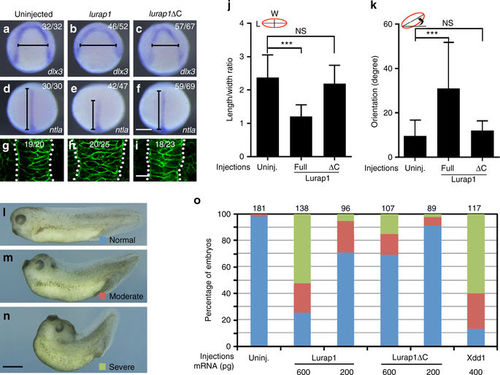
Overexpression of Lurap1 impairs CE movements and notochord cell polarity. a–f In situ hybridisation analysis using dlx3 (a–c) and ntla (d–f) to reflect the extent of neural plate convergence and axial mesoderm extension in zebrafish embryos. Overexpression of Lurap1 potently affects CE movements, while Lurap1ΔC shows a weak effect. g–i Analysis by confocal microscopy of notochord width and cell shape in indicated conditions. Representative images are shown, with statistical numbers of embryos scored from three independent experiments. j, k Graphs show the statistics of cell shape (LWR) and orientation of notochord cells in uninjected, and lurap1 or lurap1ΔC-injected embryos. Bars represent the mean values ± s.d. and the data were calculated using 20 cells randomly selected in a representative image for each condition (***P < 0.001; NS, not significant; Student’s t-test). l–n Live images of normal and CE defective Xenopus embryos at tail-bud stage. o Statistical analysis of the dose-dependent CE defects following overexpression of Lurap1 or Lurap1ΔC. The colour codes for different categories of phenotypes are indicated in the live images on the left. The data were scored from four experiments using different batches of embryos, with total number of embryos shown on the top of each stacked column. Xdd1 was included in the analysis for a comparison. Scale bars: a–f 200 µm; g–i 20 µm; l–n 1.2 mm |
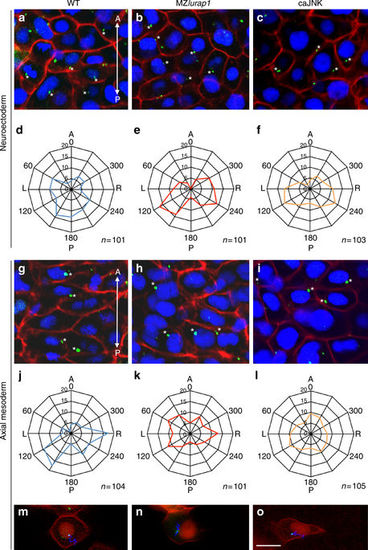
Positioning of MTOCs is affected in MZlurap1 mutants and caJNK-overexpressing embryos. a–l Immunofluorescence confocal microscopic images and statistical analysis on fixed embryos at 90% epiboly. The centriole, nucleus, and cell membrane are labelled by centrin4-GFP, DAPI, and mRFP, respectively. The position of the centriole is determined by measurement of the angle formed by the line connecting the centre of the nucleus and the centriole, relative to the anteroposterior axis passing through the nucleus. The statistical data (Student’s t-test) are presented as radar graphs, and the number on each ring represents the percentage of centrioles. The total number of cells (n) examined from three different batches of embryos is indicated on the bottom right of each graph. a–c Location of centrioles (stars) in neuroectoderm cells of indicated embryos. The images are positioned with anterior (A) on the top, and posterior (P) towards the bottom. d–f Statistical analyses (Student’s t-test) show the positions of centrioles in neuroectoderm cells. The centrioles in WT embryos display biased location at the posterior position of the nucleus. They shift to more lateral region of the nucleus in MZlurap1 and caJNK-overexpressing embryos, with some degrees of left (L) and right (R) symmetry. g–i Location of centrioles (stars) in notochord cells of indicated embryos. j–l Statistical analyses (Student’s t-test) show the preferential location of centrioles at the posterior and lateral positions of the nucleus in notochord cells of WT embryos, and randomised location of centrioles in MZlurap1 and caJNK-overexpressing embryos. m–o Representative images from live time-lapse imaging shows the movement trajectories of centrioles in notochord cells of indicated embryos at 90% epiboly. For convenience, both the nucleus and the cell membrane were all labelled in red, by Histone2B-RFP and mRFP, respectively. Scale bar: a–c, g–i, m–o 20 µm PHENOTYPE:
|
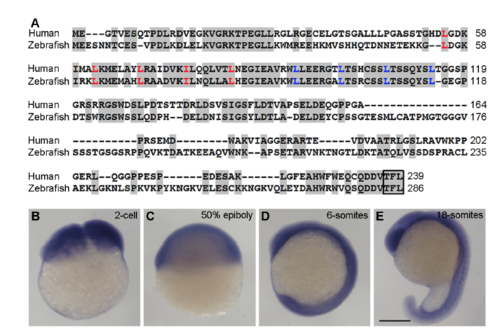
(A) Alignment of human and zebrafish Lurap1 protein sequences. Conserved residues are shadowed. The leucine (L) and isoleucine (I) residues in the tandem leucine repeats are indicated in red and blue, respectively. The C-terminus PDZ-binding motif is boxed. The numbers on the right indicate amino acid positions. (B-E) In situ hybridisation analysis of lurap1 expression pattern in zebrafish embryos at indicated stages. Scale bar: (B-E) 200 μm. EXPRESSION / LABELING:
|
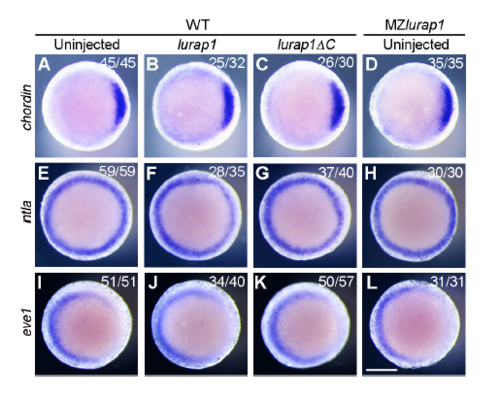
Early embryonic patterning is not affected in MZlurap1 embryos and in WT embryos overexpressing Lurap1 or Lurap1ΔC. The expression patterns of chordin (A-D), ntla (E-H), and eve1 (I-L) were analysed in indicated embryos at shield stage. Animal pole view with dorsal on the right. Scale bar: 200 μm. |
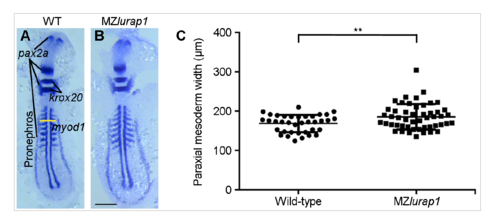
The defective CE phenotypes in MZlurap1 mutants are not caused by a developmental delay. (A,B) Simultaneous in situ hybridisation analysis of pax2a, krox20, and myod1 expression patterns in flat-mounted WT and MZlurap1 embryos with equal somite number. The yellow horizontal line defines the inner sides of the pronephric anlages, and reflects the width of the paraxial mesoderm. (C) Scatter plot shows that MZlurap1 embryos display wider paraxial mesoderm. The paraxial mesoderm width was defined as the distance between the inner sides of the pronephric anlage at the third somite level. Bars represent the mean values ± s.d. from two independent experiments (**, P<0.01; Student’s t-test). Scale bar: (A,B) 200 μm. PHENOTYPE:
|
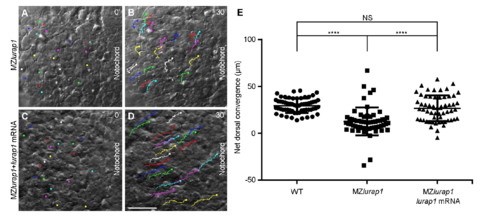
Lurap1 rescues dorsal convergence of lateral cells in MZlurap1 mutants. (A-D) Representative first and last images from live time-lapse movies show the convergence movement of lateral cells in uninjected MZlurap1, and lurap1-injected MZlurap1 embryos, with the anterior region positioned on the top. (E) Scatter plot shows the net distance reached by lateral cells toward the notochord in indicated embryos. Bars represent the mean values ± s.d. from three independent embryos (****, P<0.0001; NS, not significant; Student’s ttest). Scale bar: (A-D) 50 μm. |
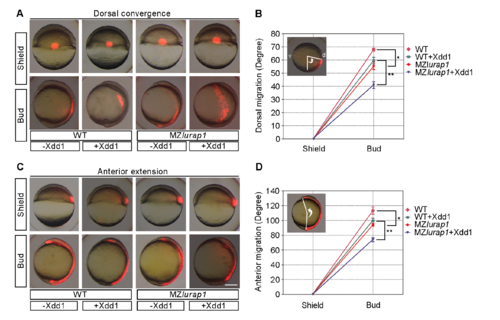
Functional interaction between Lurap1 and Xdd1 in CE movements. (A) Xdd1 enhances dorsal convergence defect in MZlurap1 embryos. (B) Statistical analysis of the convergence defect. The extent of convergence is reflected by the angle formed between the line connecting the centre of the embryo to the labelled cells, and the line perpendicular to the dorsal (d) and ventral (v) axis in animal pole view. Bars represent the mean values ± s.d. from three independent experiments using at least 30 embryos in each condition (*, P<0.05; **, P<0.01; Student’s t-test). (C) Xdd1 enhances extension movement defect in MZlurap1 embryos. (D) Statistical analysis of the extension defect. The extent of extension is represented by the angle between the most anteriorly and the most posteriorly labelled cells, with vertex at geometric centre of the embryo. Bars represent the mean values ± s.d. from three independent experiments using at least 30 embryos in each condition (*, P<0.05; **, P<0.01; Student’s t-test). Scale bar: (A,C) 200 μm. |
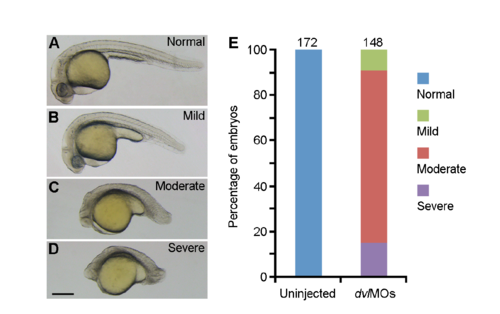
Defective CE phenotypes in dvl2 and dvl3a double morphants. (A-D) The embryos were injected with 4 ng dvl2MO and 10 ng dvl3aMO (dvlMOs), and the resulting phenotypes were observed at 24 hpf and grouped into 4 categories, as indicated. (E) Graph shows the percentage of different phenotypes scored from three experiments, with total number of embryos shown on the top of each stacked column. Scale bar: (A-D) 200 μm. PHENOTYPE:
|
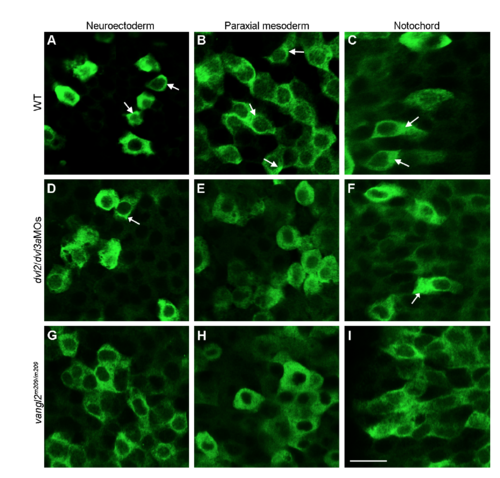
Analysis by confocal microscopy of the subcellular localisation of myc-tagged Lurap1 in different germ layers at 80% epiboly stage, as indicated. (A-C) Subcellular localisation of Lurap1 in a WT embryo. Some cells (arrows) show localised distribution. (D-F) Subcellular localisation of Lurap1 in a dvl2 and dvl3a morphant embryo. (G-I) Subcellular localisation of Lurap1 in a zygotic vangl2m209/m209 mutant. Scale bar: (A-I) 20 μm. |
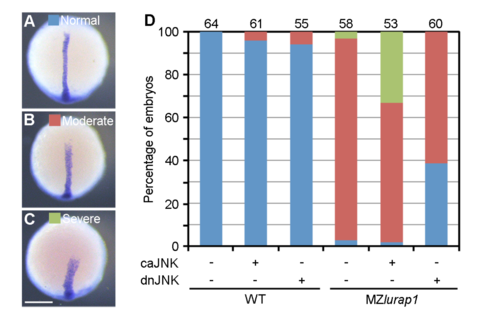
Functional interaction between Lurap1 and JNK signalling in CE movements. (A-C) Analysis of ntla expression pattern to assess the extent of CE defects. All embryos were analysed at the bud stage and classified into three groups, as indicated. (D) The defective CE phenotypes in MZlurap1 embryos are enhanced by caJNK, and rescued by dnJNK. The data were obtained from three experiments, with total number of embryos shown on the top of each stacked column. Scale bar: (A-C) 200 μm. |