
- Title
-
Retinoic acid temporally orchestrates colonization of the gut by vagal neural crest cells
- Authors
- Uribe, R.A., Hong, S.S., Bronner, M.E.
- Source
- Full text @ Dev. Biol.
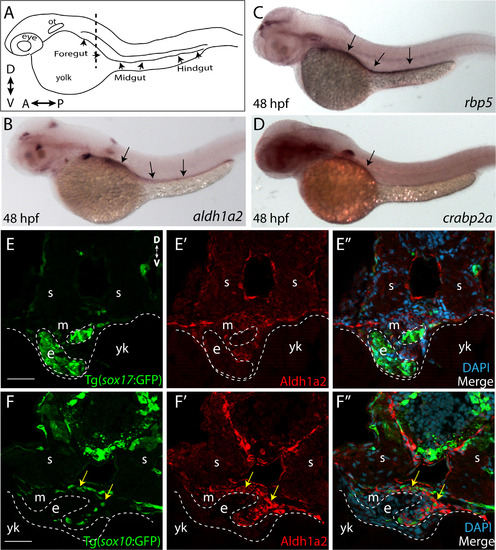
RA pathway components are expressed along the gut during ENS development. (A) Cartoon illustration of a 1-dpf zebrafish embryo depicted laterally to reveal the location of the foregut, midgut and hindgut. ot-otic, d-dorsal, v-ventral, a-anterior, p-posterior. (B) Whole-mount in situ hybridization against aldh1a2 at 48 hpf reveals its localization along all levels of the gut tube. (C) Whole-mount in situ hybridization against rbp5 at 48 hpf reveals its localization along all levels of the gut tube. (D) Whole-mount in situ hybridization against crabp2a at 48 hpf reveals its localization along the foregut. (E-E’’) Cryosection through the level of the foregut depicts Aldh1a2 protein localization (red) in the gut mesenchyme (m), but not in the gut endoderm (e), marked by sox17:GFP. s-somite, yk-yolk (F-F’’) Cryosection through the level of the foregut depicts Aldh1a2 protein localization (red) in the gut mesenchyme (m) and within neural crest cells migrating in the gut mesenchyme (arrows), marked by sox10:GFP. s-somite, yk-yolk. Scale bars: 50 μM. |
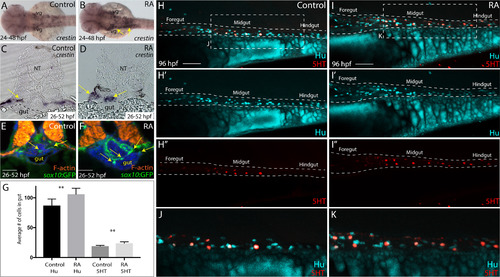
RA treatment during enteric neural crest migration stages enhances enteric neuron numbers. (A-B) A dorsal view following whole-mount in situ hybridization at 48 hpf for crestin in control (A) and RA-treated larvae (B) reveals neural crest localization along the embryo. RA-treated embryos display an expansion of neural crest, arrows (B), when compared to control (A). vg-vagal (C-D) Cryosections through the foregut of larvae at 52 hpf following in situ hybridization for crestin in (C) control and (D) RA-treated larvae shows an expanded distribution of crestin+ neural crest near the vicinity of the gut (arrows), when compared with control larvae. NT- neural tube (E-F) Transverse sections depicting the localization of sox10:GFP+ neural crest in (E) control and (F) RA-treated larvae shows an expansion of neural crest near the vicinity of the gut (arrows), when compared with control larvae. Scale bars, 50 μM (G) Bar graph to represent the average number of Hu+ and 5HT+ neurons along the gut in control and RA-treated larvae at 96 hpf. Error bars indicate +/- S.E.M. , n = 6 embryos for each condition. (H-I) Lateral views of the gut at 96 hpf following whole-mount antibody staining to detect Hu+/5HT+ enteric neurons in (H-H’’) control and (I-I’’) RA-treated larvae. (J) Zoomed in view of control larval fish depicted in H. (K) Zoomed in view of RA-treated larval fish depicted in I. Scale bars, 50 μM. |
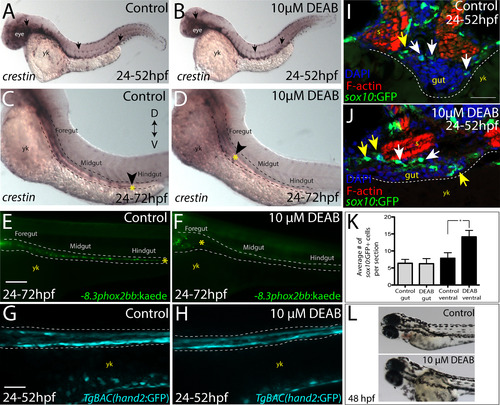
Temporal loss of RA stalls migration of enteric neural crest within the foregut without affecting enteric neural crest cell numbers. (A-B) Whole-mount in situ hybridization against crestin in (A) control and (B) DEAB treated larvae at 52 hpf. (C-D) Whole-mount in situ hybridization against crestin in control and DEAB treated larvae at 72 hpf reveals that enteric neural crest are delayed along the foregut, when compared with controls. Arrows and yellow asterisk marks caudal end of enteric neural crest migratory front along the gut. yk-yolk (E-F) Live images of -8.3phox2bb:Kaede (E) control and (F) DEAB treated larvae at 72 hpf reveals that enteric progenitors are delayed in migration along the foregut, when compared with control cells along the hindgut. yk-yolk (G-H) Live confocal projection images of hand2:GFP in (G) control and (H) DEAB treated larvae at 52 hpf reveals the presence of gut mesenchyme laterally along the gut. (I-J) Transverse cryosections show that sox10:GFP+ cells located near the foregut in (I) control and (J) DEAB treated larvae. When compared with control sections, DEAB treated larvae exhibit increased numbers of neural crest in the mesenchyme surrounding the gut (yellow arrows), while number of neural crest in direct gut contact (white arrows) are not affected. s-somite, yk-yolk (K) Bar graph depicting the average number of sox10:GFP+ neural crest with direct gut contact or in the surrounding ventral mesenchyme near the gut in control and DEAB treated larvae. n = 9 embryos for each condition. Error bars indicate +/- S.E.M. *, p<.05 with Student's t-test. (L) Bright field images of a control (top) and DEAB treated (bottom) larval fish at 48 hpf to reveal the distribution of melanophores. Scale bars in panels E-H, 100 μM; scale bar in panel I-J, 30 μM. |
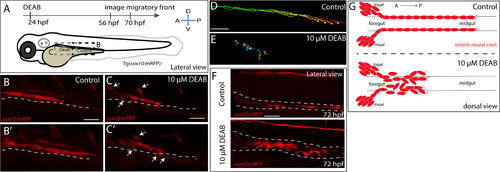
Temporal inhibition of RA results in stalled migration of enteric neural crest chains and loss of chain formation along the foregut. (A) Cartoon schematic of a zebrafish larval fish to illustrate the timing and location of live imaging experiments in panels B-C. Enteric neural crest migratory front cells along the leading edge were imaged in control and experimental conditions. (B-B’,C-C’) Cropped time lapse stills over the course of 3 h showing the enteric neural crest chain front along the foregut-midgut of a sox10:GFP+ control larval fish (B-B’) and the foregut a DEAB treated (C-C’) larval fish. The DEAB treated enteric neural crest chain exhibits delayed migration along the foregut and solitary cells detached from the chain (arrows), while the control enteric neural crest chain front was observed migrating along the midgut collectively. (D-E) Cell tracks of control (D) and DEAB treated (E) enteric neural crest show that DEAB treated enteric neural crest cells fail to progress caudally along the gut, when compared with control. (F) Whole mount immunochemistry against RFP reveals that at 72 hpf, control enteric neural crest chains are maintained along the gut, while DEAB treated enteric neural crest have dissociated along the foregut. (G) Cartoon schematic summarizing the neural crest chain migration phenotype observed following loss of RA along the gut. Red cells depict neural crest migrating in chains along the gut tube in control (top) and in DEAB treated fish (bottom). DEAB treated neural crest chains never make it past the foregut, where they become ectopically localized in the vicinity surrounding the gut. Scale bar in B,C,D and E: 40 μM; scale bar in F: 50 μM. |
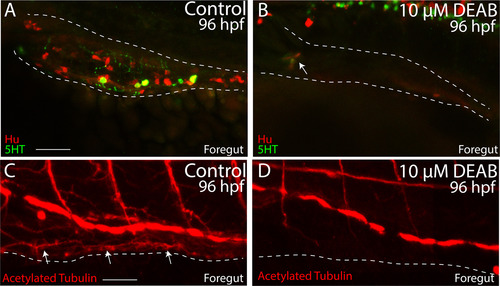
Temporal loss of RA causes total intestinal aganglionosis. (A-B) Lateral view of the foregut of a control (A) and DEAB treated larval fish (B) following double immunochemistry against Hu (red) and 5HT (green) shows that control fish successfully differentiate enteric neurons, while DEAB treated fish lack almost all neurons. A small cluster of ~3 neurons was detected in the anterior foregut of the DEAB treated larval fish (arrow in B). (C-D) Lateral view of the foregut of a control (C) and DEAB treated larval fish (D) following immunochemistry against Acetylated Tubulin shows that control fish contain differentiated enteric neurons, along with axons (arrows), while DEAB treated larval fish do not. Scale bar in A and C: 30 μM. Anterior to the left. |
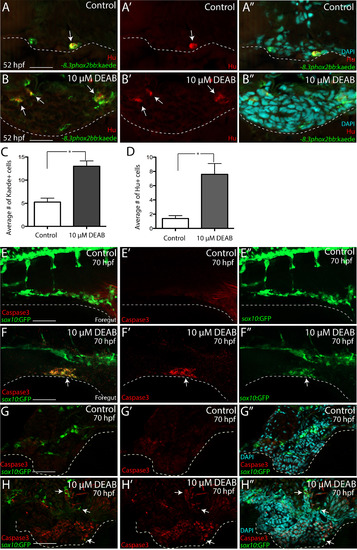
RA depletion causes accumulation of enteric progenitors in the ventral mesenchyme near the foregut and their apoptosis. (A-A’’-B-B’’) At 52 hpf, transverse sections through the foregut of control (A-A’’) and DEAB treated larvae (B-B’’) reveal the location of -8.3phox2bbb:Kaede+/Hu+ enteric progenitors (arrows), (C-D) Bar graphs depict the average number of Kaede+ enteric progenitors (C) and Hu+ enteric neurons (D) in control and DEAB treated larval foregut sections. n=5 embryos for each condition. Error bars indicate +/- S.E.M. *, p<.05 with Student's t-test. (E-E’’-F-F’’) Whole mount double immunochemistry against activated-Caspase3 (red) and GFP (green) in sox10:GFP control (E-E’”) and DEAB treated (F-F’’) larval fish. GFP+/Caspase3+ cells are present along the foregut of DEAB treated fish, however not detected in control embryos. (G-G’’, H-H’’) At 70 hpf, transverse sections through the foregut of control (G-G’’) and DEAB treated larvae (H-H’’) show the location of sox10:GFP+ and Caspase3+ cells (red), which reveals neural crest cells that are Caspase3+ surrounding the gut in DEAB treated fish, when compared to controls. Scale bar in A, B, G-H: 20 μM; scale bar in E,F: 60 μM. |
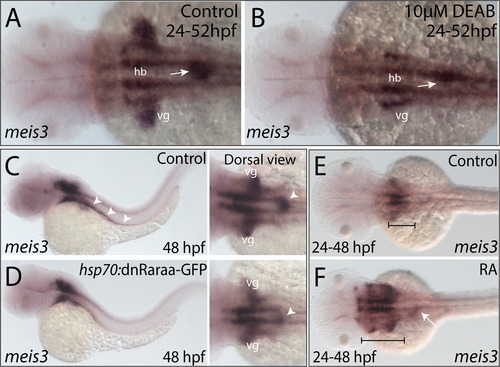
RA modulates the spatial expression of meis3 in the vagal and foregut tissue domains. (A-B) Following DEAB treatment from 24 to 52 hpf (B), the expression area of meis3 in the vagal (vg) region (yellow arrow) and foregut tissue (white arrow) is diminished when compared with control larvae (A). (C-D) Following heat shock induction, dnRaraa-GFP+ (D) larval fish exhibit a reduced expression domain of meis3 along the foregut (arrowhead) and vagal region, when compared to heat shock controls. (E-F) Following RA incubation from 24 to 48 hpf (F), the hindbrain expression of meis3 was rostrally expanded (brackets), as well as the foregut (arrow), when compared with control larvae (E). |
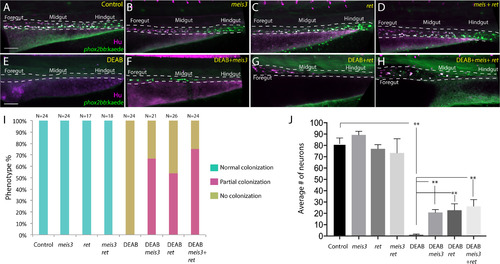
Ectopic expression of meis3 and/or ret is sufficient to partially rescue gut colonization in embryos temporally lacking RA. (A-H) Maximum intensity confocal projection images show Hu+/-8.3phox2bb:Kaede+ enteric neurons along the gut of (A) control larvae, (B) larvae expressing 40 pg of meis3, (C) larvae expressing 50 pg of ret, (D) larvae expressing 40 pg meis3 and 50 pg ret; (E) DEAB treated larvae, (F) DEAB treated larvae expressing 40 pg meis3, (G) DEAB treated larvae expressing 50 pg ret, (H) DEAB treated larvae expressing 40 pg meis3 and 50 pg ret. (E) Bar graphs depicting the percentage of larvae exhibiting normal colonization (neurons along whole length of gut), partial colonization (neurons present to the midgut) and no colonization (no neurons along the gut). (J) Bar graphs showing the average number of neurons for the rescue conditions shown in A-H. Error bars indicate S.E.M. **, p<.01 with Student's t-test. Scale bar in A-D: 60 μM. |
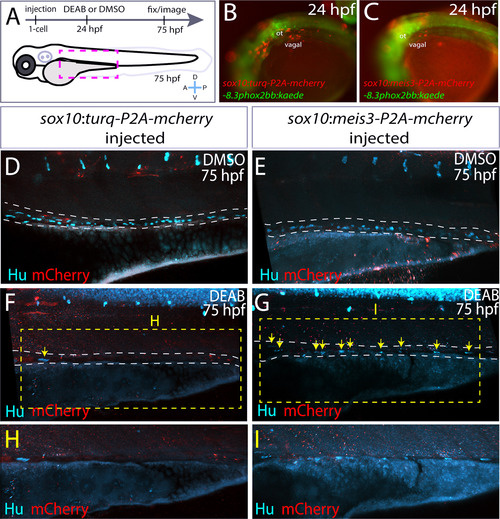
Ectopic expression of meis3 in the neural crest partially rescues gut colonization following RA inhibition. (A) Cartoon schematic summarizing injection and treatment experiments. (B-C) Live images of phox2bb:Kaede/mCherry+ 24 hpf embryos injected with (B) pDest-sox10:turq-P2A-mcherry-pA2, or (C) pDest-sox10:meis3-P2A-mcherry-pA2. Lateral views, ot-otic. (D-I) Maximum intensity confocal projections following immunochemistry against mCherry (red) and Hu (cyan) at 75 hpf in larvae expressing (D, F, H) pDest-sox10:turq-P2A-mcherry-pA2, or (E, G, I) pDest-sox10:meis3-P2A-mcherry-pA2, following treatment with DMSO or DEAB, respectively. (H-I) Zoomed in view of the insets from F and G, respectively. Scale bars: 60 μM. |
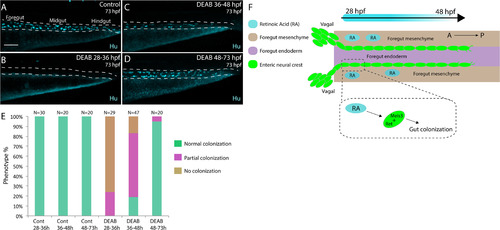
Stage-specific disruption of RA during neural crest entry and migration along the foregut, but not thereafter, leads to colonization defects. (A-D) Maximum intensity confocal projections reveal Hu+ neurons in lateral views of the gut at 73 hpf in (A) Control larvae (DMSO treated), and larvae treated with DEAB from (B) 28–36 hpf, (C) 36–48 hpf, and (D) 48–73 hpf. Scale bar: 70 μM (E) Bar graphs depicting the percentage of larvae exhibiting normal colonization (neurons along whole length of gut), partial colonization (neurons present to the midgut) and no colonization (no neurons along the gut). (F) Cartoon illustration of the role of RA and Meis3 during enteric colonization of the gut. RA (cyan) is synthesized along the foregut mesenchyme (beige) concomitant with enteric neural crest (green) entry into the gut from the vagal neural crest domains. Meis3, functionally downstream of RA in the neural crest, and/or RET regulate caudal colonization of the gut during enteric nervous system development. The action of RA affects enteric colonization primarily during early foregut migration phases (28–48 hpf). |
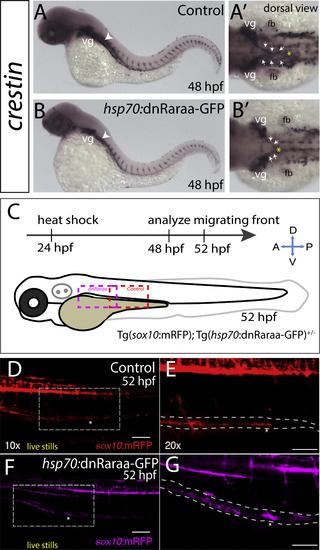
Heat shock attenuation of RA signaling function leads to delayed colonization of the gut by enteric neural crest cells. (A-B) crestin whole-mount in situ hybridization in control heat shock (GFP-) larvae (A) and heat shock dnRaraa-GFP+ larvae (B) at 48 hpf, arrowhead points to anterior foregut region. Dorsal views reveal that neural crest cell entry along the foregut is delayed (arrows) in dnRaraa-GFP+ larvae (B’), when compared with control larvae (A’). vg-vagal, fb-fin bud (C) Cartoon schematic to depict genotype and time course of heat shock attenuation experiments shown in panels D-G. (D-G) Live confocal images showing sox10:mRFP-/+; hsp70:dnRaraa-GFP-/+ larvae at 52 hpf to reveal enteric neural crest chain localization along the gut. Lateral views show that enteric neural crest reside within the foregut following heat shock induction of dnRaraa-GFP, while control heat shock enteric neural crest are located within the midgut at the same time, asterisks denote caudal end of the migratory chain. Scale bar in D and F, 100 microns; in E and G, 50 microns. |
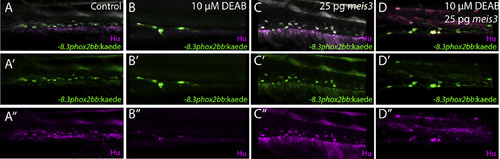
Ectopic expression of 25 pg of meis3 is sufficient to partially rescue gut colonization in embryos temporally lacking RA (A-D’’) Whole mount double immunochemistry shows Hu+/-8.3phox2bb:Kaede+ enteric neurons along the gut of (A-A’’) control, (B-B’’) DEAB treated larvae, (C-C’’) larvae injected with 25 pg meis3, and larvae injected with 25 pg meis3 and treated with DEAB (D-D’’). While larvae treated with DEAB from 24 to 73 hpf exhibit a severe loss of enteric neurons (B-B’’), embryos treated with DEAB also expressing 25 pg meis3 exhibit a partial rescue of enteric neuron localization along the midgut (D-D’’). |
Reprinted from Developmental Biology, 433(1), Uribe, R.A., Hong, S.S., Bronner, M.E., Retinoic acid temporally orchestrates colonization of the gut by vagal neural crest cells, 17-32, Copyright (2017) with permission from Elsevier. Full text @ Dev. Biol.