
- Title
-
Life-Long Neurogenic Activity of Individual Neural Stem Cells and Continuous Growth Establish an Outside-In Architecture in the Teleost Pallium
- Authors
- Furlan, G., Cuccioli, V., Vuillemin, N., Dirian, L., Muntasell, A.J., Coolen, M., Dray, N., Bedu, S., Houart, C., Beaurepaire, E., Foucher, I., Bally-Cuif, L.
- Source
- Full text @ Curr. Biol.
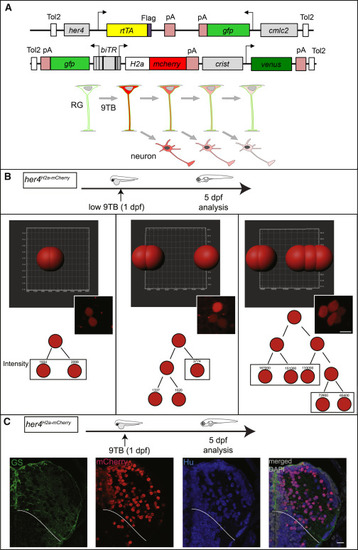
Neuronal Birthdating from her4-Expressing RGs In Vivo (A) Genetic strategy. Top: 9-tert-butyldoxycycline (9TB) triggers stable H2a-mCherry and transient GFP activation in her4-positive RGs in double-transgenic animals for the depicted constructs. Bottom: neurons generated by the first RG (top, green) divisions following 9TB induction inherit detectable levels of H2a-mCherry (red). The label is lost upon successive divisions. (B) Imaris quantification of mCherry immunostaining in 2- (left; n = 6), 3- (middle; n = 2), or 5- (right; n = 1) cell clones from different her4H2a-mCherry animals pulsed with 9BT at 1 dpf and analyzed at 5 dpf. Top: Imaris segmentation of mCherry-positive cells in individual clones. Middle: corresponding photomicrograph. Bottom: reconstructed lineage trees and fluorescence intensities. Scale bar, 7 μm. (C) Neuronal fate of the mCherry-labeled daughter cells of her4-positive RGs in her4H2a-mCherry,9BT(1dpf) fish analyzed at 5 dpf. Triple immunocytochemistry for GS, mCherry, and HuC/D on a pallium cross-section (one hemisphere). White lines indicate pallial-subpallial boundary. Scale bar, 10 μm. See also Figures S1-S3. Abbreviation definitions can be found in S1B EXPRESSION / LABELING:
|

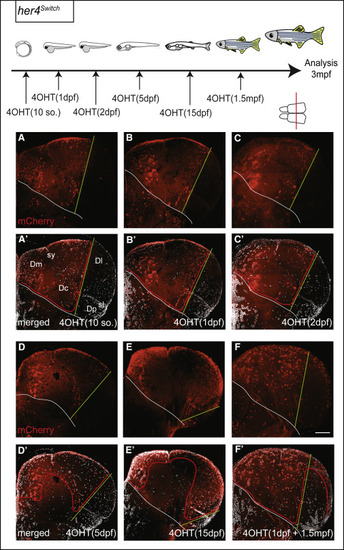
Zebrafish Pallial Neurogenesis Follows a Sequential Stacking Process: Medio-lateral Analysis Top: experimental design. (A–F′) Distribution of mCherry-positive neurons (A–F) born from her4-positive RGs in her4H2a-mCherry induced with 9TB at the stages indicated. Cross-sections at 3 mpf at mid-antero-posterior levels, the level indicated by a red line on telencephalon dorsal view, are co-labeled for parvalbumin (PV; A′–F′). Solid white lines indicate pallium-subpallium boundary. Scale bar, 50 μm. (G) Color-coded map of the position in the adult brain (left: “open” whole-mount view; middle: horizontal section; right: cross-section) of the neurons born from her4-positive RGs at the stage indicated. See also Figure S4. |

Zebrafish Pallial Neurogenesis Follows a Sequential Stacking Process: Antero-posterior Analysis Top: experimental design. (A–D′) Horizontal sections are shown and the level is indicated by a red line on telencephalon lateral view; same stainings as in Figures 2Figures 2A–2F′. Red and orange arrows indicate anterior and posterior limits of the mCherry-positive neuronal layers, respectively. Red asterisks in (D) and (D′) indicate RGs maintaining the mCherry label. (E–F′) Transparent whole-mount preparation of a her4H2a-mCherry,9TB(15dpf) pallium at 3 mpf. The pallium is observed from different angles (E: dorsal anterior left; F: lateral oblique). Scale bars, 100 μm. |
Continuous Neurogenesis from the Pallial her4-Positive RG Population Top: experimental design. Distribution of mCherry-positive neurons (A–F) born from RGs that were her4 positive at the time of 4OHT induction (stages at the bottom right of each panel). Cross-sections at 3 mpf are at identical mid-antero-posterior levels and the level is indicated by a red line on telencephalon dorsal view (A′–F′: mCherry and DAPI staining). Red lines indicate boundaries between territories with mCherry-positive and -negative neuronal cell bodies (mCherry is cytoplasmic in the ubi:switch line [3535], and thus also stains processes). White lines indicate pallial-subpallial boundaries. Green lines delimit the recombined (Dm, medial part of Dl) and un-recombined (lateral part of Dl, Dp) pallial territories in her4switch animals treated with 4OHT (see [2121]; at any given time point, all pallial RGs are her4 positive [Figure S2Figure S2]; however, the pallial VZ expands laterally over time through the addition of RGs originating from a her4-negative source; therefore, the green lines shift toward the lateral with later recombination times). The her4switch fish in (F) and (F′) was subjected to two consecutive inductions, at 1 dpf (medial neurons only, left to green bar limit) and then at 1.5 mpf (superficial neurons, right to green bar limit). Scale bar, 50 μm. |

Individual Pallial RGs Are Neurogenic Lifelong Top: experimental design. (A) Whole-mount dorsal view (anterior left) of a 3-mpf pallium from a her4Zebrabow,4OHT(1dpf) fish, cleared and scanned. The position of individual cells of each clone is plotted (color coded). Brain surface (gray) was digitally added to help visualization. Scale bar, 150 μm. (B) Corresponding location of pallial subdivisions. (C–G′) Schematics (C–G) (red lines: RG layer; dashed lines: Dc limit) and thick optical cross-sections (C′–G′) of brains as in (A) highlighting the different categories of attached clones (C–E′) or detached clones (F–G′) (Table S1). “Deep” versus “superficial” clones contain neurons born before or at 5 dpf (Table S2Table S2). (F–G′) Schematics (F and G) and thick optical cross-sections (F′ and G′) of brains as in (A) with examples of detached clones. (H and I) Position of the 34 clones attached (H) or detached (I) on flattened dorsal views of the 3-mpf pallium. Clones illustrated in (C′)–(G′) are colored. Scale bar, 80 μm. See also |

Clonal Analysis with Cell-Type Identification Confirms Long-Lasting Neurogenesis from Individual Pallial RGs Top: experimental scheme. (A and A′) Whole-mount dorsal view (anterior left) of a typical 6-dpf pallial hemisphere from a her4actswitch,4OHT(5dpf) fish stained at 1 day post-treatment for mCherry and GS (counterstained with DAPI). Red arrows point to individual recombined RGs. (B and B′) Whole-mount dorsal view (anterior left) of a typical 1.5-mpf pallium from a her4actswitch,4OHT(5dpf) fish stained for mCherry, GS, and PCNA (B′). (C and D) Segmented image of clone 33 (C) and clone 34 (D) highlighted in (B′) (color coded for cell types). (E) Position of the 40 clones in flattened dorsal views of the 1.5-mpf pallium (clones 33 and 34 in B and B′ are colored). The shape of the VZ component of each clone is indicated (code bottom left). See also Figure S5 and Table S3. Scale bars, 100 μm. |

Expression in the Adult Zebrafish Pallium of Genes Identifying Neocortical Identities in Mammals and/or Birds In situ hybridization of 2-mpf pallia (A–F: whole-mount views from the top; A′–F′: low and high magnifications of cross-sections at mid-antero-posterior levels, respectively) for 6 genes (Table S4Table S4) displaying scattered expression spanning age layers (A–C) or expression restricted to the neurogenic domain (D–F). Scale bars, 200 μm (A–F); 100 μm (A′–F′); and 50 μm (A″–F″). See also Figures S6 and S7. |

Eversion exposes the germinative RG layer in the adult zebrafish pallium, related to Figure 1. A. Schematic representations of the neural stem cell (NSC)-dependent (a, b) and -independent (c) strategies shaping brain cytoarchitecture. The germinal NSC pool and its neurogenic activity are indicated in red, and neuronal identities issued from this pool are colorcoded. The output structure is depicted at the top of each panel. (a) Continuous NSC activity generates age-related layers in the mammalian neocortex, in an inside-out fashion following radial neuronal migration. (b, c) Spatially controlled NSC activity and neuronal migration events organize functional nuclei in the bird and reptile neocortex (from [S4][S5]) B. Simplified schematized cross section of the zebrafish adult pallium at medial antero-posterior levels indicating the parenchymal subdivisions and sulci referred to in this study (from [S1]). The attachment point of the tela choroida, positioning the limit of the eversion process, is indicated (gray dots and arrows) (from [S2]). The pallial germinative zone (ventricular zone, red) extends from this point to the pallial-subpallial boundary (gray dashed line). C. Simplified schematized whole-mount view of the zebrafish adult pallium (viewed from top, anterior left) indicating the germinal zone areas visible from a dorsal view, as identified in [S3]. D-G. Whole-mount dorsal views of the pallial germinal zone in transgenic her4:eGFP telencephali, identified by the expression of GFP or GS (as indicated) at 2dpf (D), 5dpf (E), 1.5mpf (F) and 3mpf (adult, G). Whole-mount preparations counterstained with DAPI. Abbreviations: Da: anterior pallium; Dc: central pallium; Dl: lateral pallium domain; Dm: medial pallium domain; Dp: posterior pallium domain; ls: lateral sulcus; t.c.: tela choroida; sy: sulcus ypsiloniformis. Scale bars: D, E : 20μm; F : 50μm; G : 100μm. |

Continuous and direct neurogenesis from radial glial (RG) cells in the zebrafish pallium from embryo to adulthood, related to Fig.1. A-E. Cross sections of transgenic her4:GFP telencephali at 2dpf (A), 5dpf (B), 15dpf (C), 1.5mpf (D) and adult stage (E) at medial antero-posterior levels (see schemes on the right), immunostained for GFP or the RG marker Glutamine Synthase (green, left panel, as indicated), the proliferation marker PCNA (red, middle panel) and counterstained with DAPI (right panel). High magnifications in insets. White dashed line: position of the pallium/subpallium boudary. Scale bars: A, B inset, C inset : 20μm; D inset, E: 50μm. Abbreviations: Di: diencephalon; e: epiphysis; Hy: hypothalamus; Me: mesencephalon; ob: olfactory bulb; Sp: subpallium; Tel: telencephalon, V: ventricle. |

Validation of the Tet-on strategy, related to Fig.2. A. Compared expression of rtTA (in situ hybridization) and GS (immunocytochemistry) (color-coded, as indicated) on cross sections of the adult pallium in a Tg(her4:rtTA) fish (one hemisphere is shown, observed inconfocal microscopy). Note that rtTA and GS are expressed in the same set of ventricular RG. B. Proportion of mCherry-positive cells among ventricular cells at three different anteroposterior levels in her4H2a-mCherry, 9TB(5dpf) fish analyzed at 1 day-post-treatment (1dpt) (n=3 brains, T-test (α=0.05, not significant). C. Compared expression of the three reporters mCherry, Flag and GFP (immunocytochemistry, color-coded as indicated) observed in whole-mount pallia (C, D) or pallial cross sections at mid-anteroposterior levels (E-G) in double transgenic Tg(her4:rtTA);Tg(GFP:biTRE:H2amCHERRY) fish induced with 9TB at 1dpf (C), 2dpf (D), 5dpf (E), 15dpf (F) and 1.5mpf (G) and sacrificed 1 day post-treatment (1dpt). Note the largely coincident expression of the three markers, the broader expression of mCherry being explained by the stability of the H2a-mCherry protein. Note also that, while her4-driven expression is limited to the pallial VZ until 5dpf (C-E), it extends to the subpallium at later stages (F, G). The red asterisk in panel G underlies a territory of the Dl VZ with low induction response at late stages (1.5mpf). The white line in E-G, right panels, indicates the pallial-subpallial boundary. Scale bars: C-E: 10μm; F, G: 50μm. |

Zebrafish pallial neurogenesis follows a sequential stacking process : anterior and posterior analysis, related to Fig.2. A-L. Localization at posterior and anterior adult pallial levels of the mCherry-positive neurons born from her4-positive RG. Position of mCherry-positive neurons on posterior (A-F) and anterior (G-L) 3mpf her4H2a-mCherry adult pallium cross sections observed in confocal microscopy (with DAPI counterstain) following 9TB induction at the stages indicated. M, N. Localization, at median pallial levels, of the neurons born at 2 and 5dpf relative to Dc. High magnification views of the confocal images shown in Fig.2C’ and D’, respectively, stained for mCherry and PV and counterstained with DAPI. Scale bars: 50µm. |

Superimposed individual brainbow clones and neuroanatomical domains, related to Figs.5 and 6. A-D. 5 clones are shown on thick cross sections of the brain shown in Fig.5A. Clone categories, as defined in Fig.5 C-G and Table S1, are indicated at the bottom right of each panel, and the clones illustrated are color-coded as in Fig.5C-I and Table S1. Note that clone n°5 and 7, shown in A and C respectively, reach into Dc. Scale bar: 80μm. E-G. Validation of clonality in the analysis of her4actswitch,T(5dpf) larvae. E. Compared distribution of the number of induced progenitors at 1 day-post-9TB (1dpt) and the number of clones at 1.5mpf (1.5 months post 9TB –mpt-). n = 20 pallial hemispheres at 1dpt and 24 pallial hemispheres at 1.5mpt. The numbers in bracket indicate the number of hemispheres concerned for each number of induced cells/clone. F. Average number of induced progenitors per hemisphere at 1dpt or induced clones per hemisphere at 1.5mpt (averaged from panel E). sem: 0.32 at 1dpt, 0.28 at 1.5mpt. Differenceis not significant (P<0.25). G. Cumulative distribution of the nearest neighbors distances separating labeled progenitors in the pallium of a her4H2a-mCherry,9TB(5dpf) animal analyzed at 1dpt (Fig.6A, A’). 84% of induced clones are located at least 15μm (approx. 4 cell diameters) away from their nearest neighbor clone. |
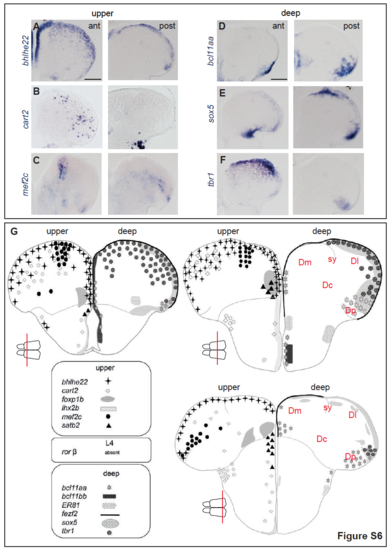
Expression in the adult zebrafish pallium of genes identifying neocortical layers in mammals and/or birds: other anteroposterior levels and summary schemes, related to Fig.7 AF. Anterior (left panels) and posterior (right panels) pallial cross sections from the specimen shown in Fig.7 (in situ hybridization for the indicated probes, blue signal), ordered here for gene probe orthology with markers of deep (left) or upper (right) layer neurons in other vertebrates (see Table S4). G. Schematic summary of the expression patterns, on cross sections of the adult zebrafish pallium at anterior, median and posterior levels (equivalent to Fig.7 and panels A-F), of all the genes tested in this study (Table S4). Scale bars: 100μm. |

Compared localization of GABA and Glutamatergic neurons with the position of neurons born at 5dpf in the adult pallium, related to Fig.7. A-B’: Cross-sections at median pallial levels of her4H2a-mCherry,9TB(5dpf) brains observed at 3mpf (confocal microscopy, single 70μm stacks), immuno-processed for mCherry and stained by in situ hybridization with the following probes: gad65/67a/67b (gad, A’) and vglut1/2.1/2.2 (vglut, B’). A, B: fluorescence channels; A’, B’: superimposed bright field and fluorescence channels; red arrows in A, B indicate the shape of the mCherry-positive domains and white dotted lines line the pallial contour. Insets are high magnifications of the boxed areas showing mCherry in the nucleus of gad- or vglut-positive neurons. Scale bar: 70 μm. |