
- Title
-
Osteoblast Production by Reserved Progenitor Cells in Zebrafish Bone Regeneration and Maintenance
- Authors
- Ando, K., Shibata, E., Hans, S., Brand, M., Kawakami, A.
- Source
- Full text @ Dev. Cell

mmp9+ Cells in Fin Ray Joints Migrate to Contribute to Tissue Regeneration (A) Labeling of mmp9+ joint cells by Cre-loxP recombination. Treatment of Tg(mmp9:CreERt2; Olactb:loxP-dsred2-loxP-egfp) with TAM induced the expression of EGFP in cells of the joints (arrows). Scale bar, 500 μm. (B) Tracking of EGFP-labeled cells during regeneration. The marked cells migrated distally to become cells within the regenerated tissue including cells in the regenerating joint (arrowheads). Dashed lines, amputation sites. Scale bar, 10 μm. (C) Zns5 and Sp7 antibody staining of a cross-section through the joint of Cre-labeled Tg. mmp9-expressing joint cells have a characteristic cell shape with dendritic projections and are positive for Zns5 (cell-surface labeling), but not Sp7. The absence of sp7 expression in the mmp9+ joint cells is also seen in the Tg(sp7:mcherry) (Figure 3F). Nuclei, TO-RPO-3. Arrowheads, representative cells that are positive for EGFP and Zns5, but not Sp7. Scale bar, 10 μm. |
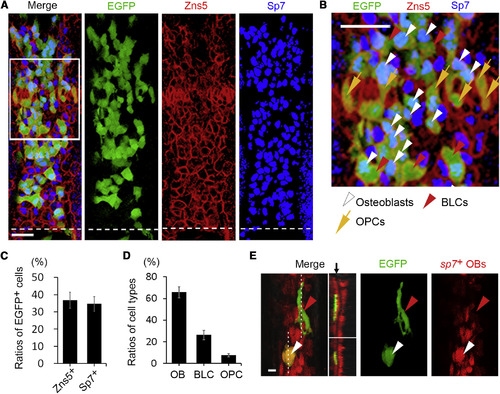
mmp9+ Cells Are the Osteoblast Progenitor Cells during Fin Regeneration (A) Confocal image of a longitudinal section of Cre-labeled Tg fin at 2 days post amputation (dpa) that were stained with Sp7, Zns5, and EGFP antibodies. Sp7 proteins and Zns5 antigens are localized in the nucleus and on the cell surface, respectively. Respective positive cells were also confirmed by nuclear staining with TO-PRO-3 (not shown). Many of the migrated mmp9+ joint cells became Sp7+ or Zns5+ cells in the regenerates. Dashed lines, amputation sites. Scale bar, 20 μm. (B) Magnification of boxed area in (A). Progenies of mmp9+ joint cells produced Sp7+ osteoblasts (white arrowheads), Sp7− BLCs (red arrowheads), or regenerated OPCs (yellow arrows). Scale bar, 20 μm. (C) Quantification of joint-derived (EGFP+) cells among Sp7+ or Zns5+ cells. Cells were counted on confocal optical sections in area distal to the amputation plate. n = 20 optical sections (different fin rays, total 5 fish). Error bars indicate mean ± SEM. (D) Ratios of contribution of joint-derived cells to osteoblasts (OBs), BLCs, or OPCs in the regenerated tissue. n = 15 fin rays (total 5 fish). Error bars indicate mean ± SEM. Cell count was performed on confocal z-stack images to confirm respective antibody staining in individual cells. OPCs and BLCs, which are Sp7−, were distinguished by their cell morphologies and tissue localization: OPCs, elongated shape along proximal-distal axis with localization in fin ray joints; BLCs, a flattened irregular shape with non-joint distribution. (E) Confocal image of a regenerating Cre-labeled Tg fin at 4 dpa, which also carries the sp7:mcherry transgene. Dashed lines indicate planes of optical sections shown on the right. Arrow, growing bone matrix; red arrowheads, BLCs; white arrowheads, OBs. Scale bar, 10 μm. |
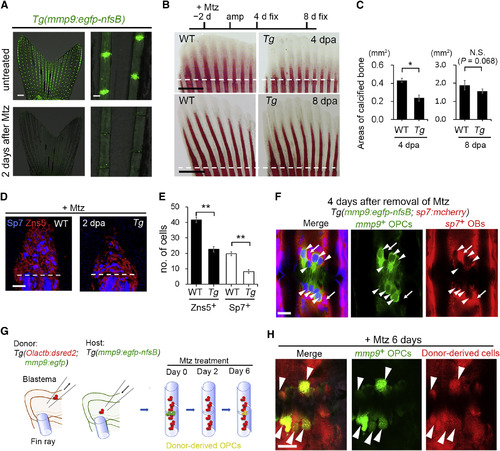
OPCs Replenished from Mesenchymal Precursors Are Significant Contributors to Bone Regeneration (A) A representative example of OPC ablation. Effective ablation of the OPCs occurs with 5 mM Mtz treatment for 2 days. Scale bars, 500 μm (left panel) and 50 μm (right panel). (B) Alizarin red S staining of regenerating WT and nfsB-expressing Tg fins treated with Mtz. Dashed lines indicate fin amputation sites. Scale bars, 500 μm. (C) Quantification of calcified areas in (B). A significant decrease of calcified tissue was observed when OPCs were ablated. Error bars indicate mean ± SEM. ∗p < 0.01, Student's two-tailed t test; n = 5 fins. N.S., not significant. (D) Detection of Zns5 and Sp7 in WT and OPC-ablated Tg regenerates. Dashed lines indicate fin amputation sites. Nuclei were counterstained with DAPI. Scale bars, 10 μm. (E) Quantification of (D). The numbers of Zns5+ and Sp7+ cells, respectively, were significantly decreased by OPC ablation. Error bars indicate mean ± SEM. ∗∗p < 0.001, Student's two-tailed t test; n = 6 confocal optical sections from different fin rays (total 5 fish). (F) Replenishment of OPCs from non-osteoblast precursors. In double Tg(sp7:mcherry; mmp9:egfp-nfsB), re-formed OPCs (arrowheads) after ablation were not mCherry+ (n = 15 of 15 joints from total 5 fish), indicating that re-formed OPCs were not derived from mCherry+ osteoblasts. Arrows point to nearby osteoblasts. Nuclei, DAPI. Scale bar, 10 μm. (G) Procedure of mesenchymal cell transplantation and host OPC ablation. Olactb:dsRed2 refers to Olactb:loxP-dsred2-loxP-egfp. Donor blastema was transplanted into the host blastema region (Shibata et al., 2016). Most of the transplanted cells contribute to mesenchymal cells. Eight days after transplantation, host OPCs were ablated with 5 mM Mtz to see whether or not the re-formed joint cells (EGFP+) were derived from DsRed2+ mesenchymal cells. (H) Emergence of OPCs from mesenchymal cells. Arrowheads point to re-formed OPCs derived from DsRed2+ mesenchyme. n = 24 fin ray joints from total 5 fish. Scale bar, 10 μm. |

Origin and Development of OPCs and Their Role in Osteoblast Maintenance (A) Tracing of early OPCs labeled at 25 dpf. Progenies of Cre-labeled OPCs contributed to neither newly added OPCs nor osteoblasts in the distal regions (n = 9 of 9 fish), suggesting that OPCs are produced by non-OPC precursor cells. Numbers denote fin ray joints. Scale bars, 100 μm. (B) A diagram of somite transplantation. Somites that ubiquitously expressed DsRed2 were taken from double Tg(mmp9:egfp; Olactb:loxP-dsred2-loxP-egfp) and transplanted into WT. (C) Differentiation of somite-derived cells into OPCs in fin ray joints. Upper panel: whole-mount view of the fin; lower panel: a section through the fin ray joint. As in a previous study in medaka fish (Shimada et al., 2013), the somite-derived cells (DsRed2+) contributed to mesenchymal cells and osteoblasts in fin rays. Significantly, the somite-derived cells also differentiated into the EGFP+ joint OPCs in 5 of 5 successful transplantations, strongly suggesting that OPCs are derived from the somites. Arrows, OPCs; arrowheads, osteoblasts or BLCs derived from transplanted somite. Nuclei, DAPI. Scale bars, 100 μm (upper panel) and 10 μm (lower panel). (D) Fluorescent stereomicroscope images of EGFP+ cells at 4 days and 114 days after Cre-loxP recombination. Joint OPCs (arrowheads) were labeled by Cre recombination at 4 months of age. Labeled OPCs gradually differentiated into cells on the surfaces of fin rays. Scale bar, 100 μm. (E) Confocal z-stack image of progenies of Cre-labeled joint OPCs in adult fish that also carry the sp7:mcherry transgene. Progenies of OPCs in uninjured adult fins contain both mCherry+ (sp7-expressing) osteoblasts (white arrowheads) and mCherry− BLCs (red arrowheads), which distribute in the non-joint region. Scale bar, 10 μm. (F) Ratios of OPC-derived osteoblasts (OBs) and BLCs in non-regenerating fin rays. Cells were counted in a fin ray segment of the central fin region in each fish. Error bars indicate mean ± SEM (n = 5 fish). |
Reprinted from Developmental Cell, 43(5), Ando, K., Shibata, E., Hans, S., Brand, M., Kawakami, A., Osteoblast Production by Reserved Progenitor Cells in Zebrafish Bone Regeneration and Maintenance, 643-650.e3, Copyright (2017) with permission from Elsevier. Full text @ Dev. Cell