
- Title
-
Targeted Pth4-expressing cell ablation impairs skeletal mineralization in zebrafish
- Authors
- Suarez-Bregua, P., Saxena, A., Bronner, M.E., Rotllant, J.
- Source
- Full text @ PLoS One
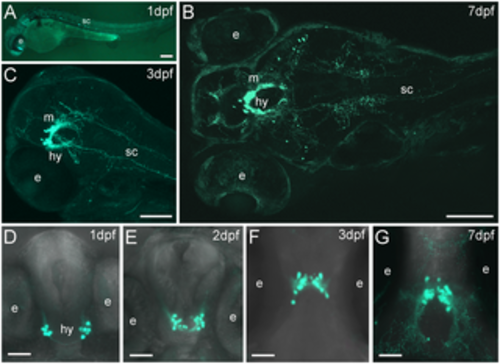
Stable transgenic Pth4:eGFP zebrafish line shows eGFP-expressing cells through development. Whole mount confocal imaging showing eGFP-expressing cells and axonal projections at 1, 3 and 7 dpf (A, B and C). Confocal z-stack projection showing two clusters of Pth4:eGFP-expressing cells on the lateral hypothalamus in a ventral view (D, E and F) or dorsal view (G). The total number of eGFP cells was measured by analyzing each 2μm thick z-plane slice from the full confocal z-stack projection in each stage of development: (D) 14±2 eGFP cells at 1dpf, (E) 22±2 eGFP cells at 2dpf, (F) 29±2 and (G) 33±1 eGFP cells at 3 and 7dpf, respectively). Note that the number of cells increases over time and axonal projections become more abundant and branched (B, G). Two groups of Pth4:eGFP-expressing cells move gradually from a caudo-ventral to a more rostro-dorsal position. Abbreviation: e, eye; hy, hypothalamus; m, midbrain; sc, spinal cord. Scale bars: 100 μm (A-C) 50 μm (D-G). |
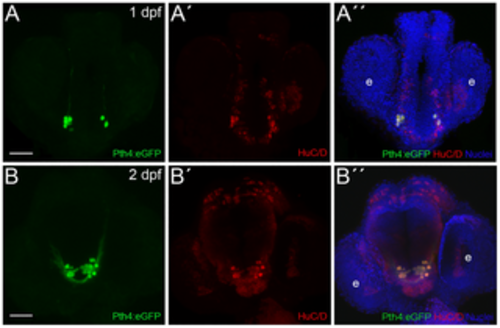
Zebrafish Pth4:eGFP-expressing cells are post-mitotic neurons. Double inmunostaining in Pth4:eGFP transgenic embryos using anti-eGFP antibody (A and B) and anti-HuC/D antibody (A´and B´) shows complete co-localization at 1 and 2 dpf (A´´ and B´´). Ventral views with anterior to the top. Pth4:eGFP: green; HuC/D: red; nuclear stain: blue. Abbreviation: e, eye. Scale bar: 50 μm. |

Two-photon laser ablation of Pth4:eGFP-expressing cells at 1 dpf and 2 dpf. Before ablation 1 and 2, Pth4:eGFP+/Bactin2:H2A-mCherry+ transgenic embryo shows two bilateral clusters of neurons in the hypothalamic area (A and D). After several rounds of ablation the eGFP-expressing cells are completely eliminated (B and E). Ablation processes example (C-C´´and F-F´´): (C and F) arrows indicate eGFP-expressing cells chosen for ablation; nuclear region of interest for targeted elimination of Pth4:eGFP neurons is defined by circles, based on red fluorescence from nuclear marker Bactin2 (C´ and F´); immediately after ablation Pth4:eGFP neurons are eliminated (marked by arrows in C´´ and F´´). Note that the untargeted cells around the eGFP-expressing cells ablated are intact (C´´ and F´´). A confocal z-stack projection (A, B, D and E) or single 2 μm thick z-plane slice (C-C´´ and F-F´´) are shown. Scales bars: 50 μm (A, B, D and E); 15 μm (C-C´´ and F-F´´). PHENOTYPE:
|

Illustration showing the development of the two clusters of Pth4:eGFP neurons in control (A-D) and ablated larvae (E-H) from 1 to 7 dpf. After first and second round of ablation, 1 and 2 (at 1 and 2 dpf, respectively) the eGFP-expressing cells are totally eliminated (E and F); at 3 dpf and 7 dpf a low number of Pth4:eGFP-expressing neurons recover (G-H), but there remains significantly decreased pth4 gene expression (***p< 0.001) in 7 dpf ablated larvae (I). Results normalized to actb1 are expressed as mean ± SEM. Confocal z-stack projections are shown. Abbreviation: e, eye. Scales bars: 50 μm. |

Ablated larvae exhibit impaired mineralization of the craniofacial skeleton but normal cartilage development. Skeletal staining in 7 dpf control larvae (A and C) shows calcification of the craniofacial bones unlike ablated larvae (B and D) with a widely non-mineralized skeleton except an incipient mineral deposit on teeth. Lateral views (A and B) and ventral views (C and D). Abbreviations: ps, parasphenoid; nt, notochord tip; op, operculum; ot, otolith; cb5, ceratobranchial arch 5; t, teeth; cl, cleithrum. Scale bars: 100 μm. PHENOTYPE:
|

ZFIN is incorporating published figure images and captions as part of an ongoing project. Figures from some publications have not yet been curated, or are not available for display because of copyright restrictions. |
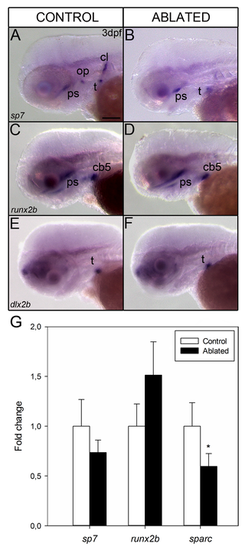
Whole mount in situ hybridization shows the gene expression pattern of osteoblast differentiation markers at 3 dpf in control (A, C and E) and ablated larvae (B, D and F) from lateral view. Expression of sp7 is detected in operculum, cleithrum, teeth and parasphenoid (A). Note the absence of expression in cleithrum and operculum in ablated larvae (B). runx2b and dlx2b display the same expression pattern before ablation (C, E) and after ablation (D, F). Quantitative RT-PCR analysis of early (runx2b), intermediate (sp7) and late (sparc) stage markers of osteoblast differentiation in 7 dpf ablated (black bars) and control larvae (white bars) (G). Results show significant down-regulation of sparc gene expression (*p <0.05) when compared with controls. Results normalized to actb1 are expressed as mean ± SEM. Abbreviations: ps, parasphenoid; op, operculum; cb5, ceratobranchial arch 5; t, teeth; cl, cleithrum. Scale bars: 100 μm. EXPRESSION / LABELING:
PHENOTYPE:
|