
- Title
-
Extracellular HSP60 triggers tissue regeneration and wound healing by regulating inflammation and cell proliferation
- Authors
- Pei, W., Tanaka, K., Huang, S.C., Xu, L., Liu, B., Sinclair, J., Idol, J., Varshney, G.K., Huang, H., Lin, S., Nussenblatt, R.B., Mori, R., Burgess, S.M.
- Source
- Full text @ NPJ Regen Med

hspd1 mutants display deficient regeneration of lateral line hair cells and caudal fins. (a) The morphology of hspd1 mutants looks normal except for the lack of an inflated swim bladder at 5 dpf. hspd1+/* are wild-type or heterozygous fish. hspd1−/− are confirmed homozygous mutant fish. (b) RT-PCR analysis of hspd1 mRNA expression. The retroviral DNA is inserted in the first intron of the hspd1 gene, and the first exon is noncoding. The primers used for hspd1 knockdown analysis bind to the exon 3 and exon 6. β-actin is used as an internal reference. (c) Hair cell regeneration analysis using CuSO4 or neomycin to ablate hair cells. Concentrations are as labelled. The reduction is significant for both treatments (n=10, P<0.001 for both copper and neomycin). Asterisks in the graphs indicate a significant difference between the control and mutant embryos. (d) Caudal fin regeneration is deficient in hspd1−/− mutants. The end of the tail was removed at 3 dpf, and regeneration evaluated at 4 dpa, and then phenotype was correlated to genotype. Defects in fin regeneration were observed in 1/21 of hspd1+/* embryos, and 14/18 of hspd1−/− embryos. Bars = 500 μm in a and 200 μm in d. dpa, day post amputation; dpf, day post-fertilisation; RT-PCR, reverse transcriptase PCR. EXPRESSION / LABELING:
PHENOTYPE:
|
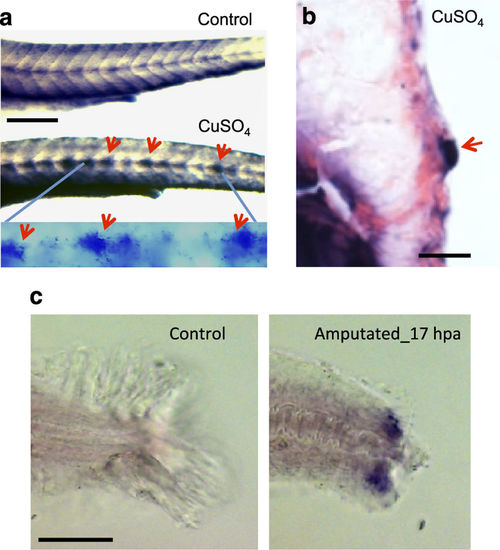
hspd1 expression is induced after injury. (a) hspd1 expression is induced in lateral line neuromasts by CuSO4-mediated hair cell ablation. Pictures are of embryos collected 5 h post-copper or control treatment, the time point with the largest expression differences. Arrows indicate the induced expression in lateral line neuromasts. The bottom panel is a higher magnification to more clearly show the neuromast-specific expression only seen in a CuSO4-treated embryo. (b) Histological sectioning shows the induced hspd1 expression in a cross-section of a neuromast localised in the trunk. (c) hspd1 expression is induced by caudal fin amputation. Pictures are of embryos collected at 17 h post amputation (or an undissected control), which was the peak of hspd1 expression. Bars = 200 μm in a and c, 20 μm in b. EXPRESSION / LABELING:
|
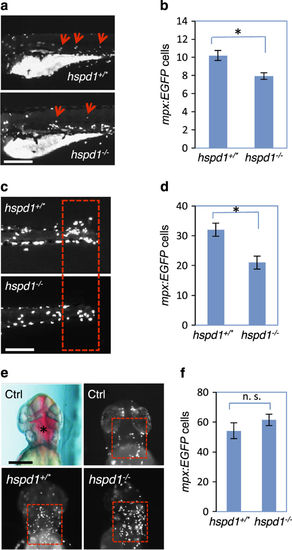
hspd1 mutants have impaired neutrophil migration towards the injury site. (a) Neutrophil migration is triggered by hair cell ablation. Neutrophils were labelled by Tg(mpx:EGFP) and pictures were taken after 1 h of CuSO4 treatment. Arrows point to neutrophil accumulation in lateral line neuromast areas. (b) Quantification of the neutrophils that migrated to the regions surrounding the neuromasts; scoring was done before the genotypes were known. The reduction is significant (n=12, P=0.001). (c) Neutrophil migration triggered by caudal fin amputation. Pictures were taken at 17 h post amputation, when the difference in the number of migrated neutrophils between control and mutant embryos was greatest. (d) Quantification of the neutrophils migrated to the amputated fin at 17 h post amputation; scoring was done before the genotypes were known. Red boxes demarcate the areas used for quantification. The reduction is significant (n=10, P<0.001). (e) Neutrophil migration triggered by injection of LPS. The top panels show the control embryos injected with phenol red buffer and BSA. The red box in the top right panel shows a low number of mpx:EGFP cells accumulated in the BSA injection area. The bottom panels show control and hspd1 mutant embryos injected with 150 pg LPS. Red dotted boxes show that LPS injection strongly attracts neutrophils into the injection area. (f) Quantification of neutrophils migrated to the LPS injection site in hspd1 control and mutant embryos. Red dotted boxes demarcate the areas used for quantification. There is no significant difference between mutant and control in neutrophil’s ability to migrate (n=10, P=0.291). Asterisks indicate a significant difference. Bars = 200 μm. BSA, bovine serum albumin; LPS, lipidpolysaccharide. PHENOTYPE:
|

Exogenous HSP60 attracts both neutrophils and macrophages. (a) GroEL injected into the brain ventricle attracted mpx-positive neutrophils. Pink region outlined in first panel shows tracer dye in the zebrafish brain ventricle. Red arrows in the other three panels indicate injection site in the uninjected, control protein injected, or GroEL/human HSP60 injected embryos. (b) Quantification of neutrophil infiltration stimulated by GroEL. There is a significant increase in neutrophil numbers between the indicated two groups (n=10, P<0.05 for all comparisons). (c) Quantification of neutrophil infiltration stimulated by human HSP60 injected into the brain ventricle. Human HSP60 attracts significantly more neutrophils than human GAPDH (n=12, P<0.001). (d) GroEL injected into the brain ventricle attracted mpeg-postive macrophages. (e) Quantification of macrophage infiltration stimulated by GroEL. There is a significant increase in Tg(mpeg:EGFP) cells upon GroEL injection (n=8, P=0.003). (f) Inhibitory peptide L-37pA blocks GroEL’s neutrophil chemoattraction. Injection for each condition was into the brain ventricle. GroEL elicited a strong chemoattractive response, but the inhibitor of CD36, L37pA, prevented infiltration. Pictures were taken 3 h post injection into the brain ventricle and neutrophils were labelled by Tg(mpx:EGFP). Red boxes demarcate the areas in which neutrophils were quantified. (g) Quantification of the experiments in f. The increase in Tg(mpx:EGFP) cells is significant upon GroEL injection (n=10, P<0.001), but not significant upon GroEL/L37pA co-injection (n=10, P=0.109) or L37pA injection alone (n=10, P=0.962). Asterisks in the graphs indicate a significant difference. Bars = 200 μm. BSA, bovine serum albumin. |

Exogenous HSP60 promotes hair cell regeneration and signalling inhibitor L-37pA inhibits regeneration. (a) GroEL injected into the trunk attracted mpx-positive neutrophils similar to brain ventricle injections. The areas framed with red dotted lines in the left panels indicate the areas of injection (the panel on the left) or quantification (three panels on the right). The red colour shown within the dotted lines of the first panel is from phenol red in the injection buffer. BSA protein is used as a control for GroEL protein and also a control for assessing the needle-induced injury. Red arrows point to the sites of injection. (b) GroEL injected into the trunk promotes hair cell regeneration. The top panel shows a 7 dpf zebrafish larvae stained with Yopro-1, with each fluorescent dot indicating a hair cell containing neuromast. The injection site is pointed. The bottom panels show representative images of hair cells in a neuromast for each condition. (c) Quantification of hair cell sensitivity to copper (left) and rate of regeneration (right). GroEL does not provide protection from cell death (n=16, P=0.471), but does significantly boost regeneration rates (n=15, P<0.001). (d) Quantification of hair cell regeneration stimulated by human HSP60. Human HSP60 injected into the trunk promotes hair cell regeneration significantly (n=34 for GAPDH, n=36 for human HSP60, P<0.001). (e) L-37pA injected into the trunk before hair cell ablation inhibits hair cell regeneration (n=8, P=0.002). Injection of 50 or 100 pg of L-37pA inhibits regeneration to a similar degree (n=8, P=0.176). (f) L-37pA injected into the trunk 1 day after hair cell ablation inhibits hair cell regeneration (n=13, P=0.01). For all experiments, hair cells were ablated in WT embryos at 5 dpf, and then hair cell regeneration evaluated at 7 dpf. (g) LPS injected into the trunk does not promote hair cell regeneration. Injection of 75 pg of LPS does not affect hair cell regeneration (n=8, P=0.938), whereas injection of 150 pg of LPS caused a slight but significant inhibition of regeneration (n=8, P=0.023). Asterisks in the graphs indicate a significant difference between the indicated two groups. Bars = 200 μm in (a), 10 μm in (b). dpf, days post-fertilisation. BSA, bovine serum albumin; HCR, hair cell regeneration; HCS, hair cell sensitivity; LPS, lipidpolysaccharide; WT, wild type. |

Extracellular HSP60 promotes caudal fin regeneration. (a) Schematic of injection site and amputation site. (b) Caudal fin area measured in the injected embryos at 4 dpa. Quantified areas are framed with dotted red lines, starting from the anterior end of the ventral pigmentation break. (c) Quantification of caudal fin regeneration in GroEL- and BSA-injected embryos. A significant increase (indicated by an asterisk) in the fin area is detected in GroEL-injected embryos (n=10, P=0.003). Bars = 500 μm in a, 100 μm in b. BSA, bovine serum albumin; dpa, day post amputation. |

hspd1 is necessary for cell proliferation, and extracellular HSP60 stimulates intracellular hspd1 expression. (a) Impaired proliferation of supporting cell in hspd1 mutants, assayed by EdU labelling analysis. Five-day-old control and hspd1−/− mutant embryos were used for hair cell ablation, EdU labelling and then quantified for cell proliferation. Pictures shown are examples from 24 h post hair cell ablation. Arrows point to the proliferating supporting cells in the lateral line neuromasts. (b) Quantification of the EdU signal. Quantification performed before genotype was determined (n=12, P<0.001). (c) Exogenous GroEL promotes cell proliferation during regeneration. WT embryos at 5 dpf were injected with GroEL, hair cells were ablated and dividing cells labelled with EdU. Data shown were quantified at 24 h post ablation (n=14, P<0.001). (d) Exogenous GroEL promotes supernumerary hair cells. WT embryos at 2 dpf were injected with GroEL into the trunk. Hair cells were counted at 5 dpf by Yopro-1 staining (n=16, P=0.006). (e) GroEL injected in the trunk induces hspd1 expression in the trunk and lateral line neuromasts as revealed by whole-mount in situ hybridisation. WT embryos at 2 dpf were used for 125 pg of GroEL or BSA injection and for analysing hspd1 expression at different time points after the injection by whole-mount in situ hybridiation. Pictures shown are representative examples from 7 h post injection. GroEL-injected embryos showed darker staining in the trunk and lateral line neuromasts. Two red boxes frame the enriched expression of hspd1 in two neuromasts. (f) The magnified images of the two boxed areas of GroEL-injected embryos, revealing the induced hspd1 expression specifically in the neuromasts. Asterisks in b–d indicate a significant difference between the two groups. Bars = 200 μm in a, 500 μm in e and 50 μm in f. dpf, days post-fertilisation. BSA, bovine serum albumin; WT, wild type. |

|

|

|

|