
- Title
-
Novel Heparin Receptor Transmembrane Protein 184a Regulates Angiogenesis in the Adult Zebrafish Caudal Fin
- Authors
- Farwell, S.L.N., Reylander, K.G., Iovine, M.K., Lowe-Krentz, L.J.
- Source
- Full text @ Front. Physiol.
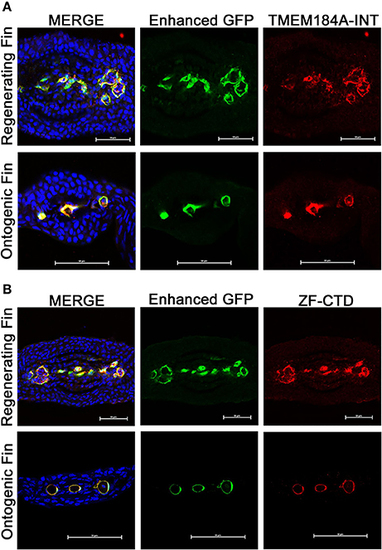
Ontogenic and regenerating zebrafish fins express Tmem184a in the vasculature. Representative confocal microscopy images of cryogenic transverse sections of regenerating and ontogenic Tg(Fli1:EGFP) fins. All sections were stained with a GFP antibody to enhance EC fluorescence/visualization along with DAPI to easily identify fin rays. (A) Sections were stained for Tmem184a using a commercial antibody. (B) Sections were stained for Tmem184a using a zebrafish-specific antibody (ZF-CTD). Each image shows one individual fin ray. The arrowhead points to a mature artery, and the arrows mark mature veins. Scale bars = 50 μm. DAPI staining is blue, EC staining is green, and Tmem184a staining is red for all images. Sections from more than 10 individual fish were immunostained and analyzed for each combination of antibodies. EXPRESSION / LABELING:
|

Tmem184a MOs-mediated knockdown results in aberrant vascular regeneration. Representative fluorescence microscopy images of fixed 4 dpa Tg(Fli1:EGFP) whole and cryosectioned fins. Each MO was injected into regenerating tissue of fin rays 1–6 at 3 dpa, and the other side was left uninjected. (A) There is no obvious difference in vascular phenotype between the side of a fin injected with Con MO vs. the uninjected side. Con MO n = 12. Injection with ATG MO results in two predominant phenotypes: impaired vascular outgrowth (top) and tangled regenerating vasculature (bottom). ATG MO n = 18. Scale bars = 200 μm. (B) 10x zoomed sections of injected fin shown in (A) allow easier discernment of regenerating vessels. (C) Example transverse maximum intensity projections (bottom) and alpha blended 3D projections (top) show the extent of vessel disorganization in an ATG MO-injected fin ray compared to one injected with Con MO. Scale bars = 50 μm. PHENOTYPE:
|
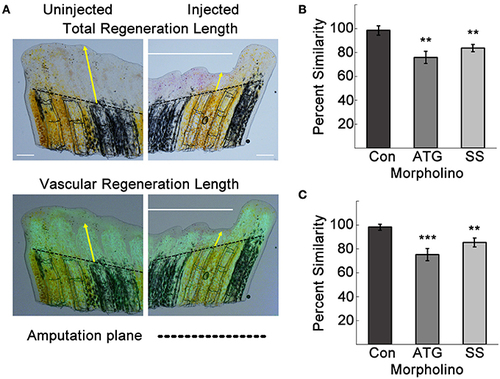
Tmem184a knockdown results in decreased total and vascular regeneration. Total and vascular regeneration of the third fin ray of the uninjected and injected sides of each fin were measured from the amputation plane (dotted line) to the tip of the fin and the tip of the regenerating vasculature. (A) Example brightfield image and superimposed vascular fluorescence image with yellow arrows pointing out total and vascular regeneration length measurements. (B) Quantitation of total regeneration length of the third fin ray of control, ATG, and SS MO-injected fins compared to the uninjected side. (C) Quantitation of vascular regeneration length as in (B). Graphs are shown as mean percent similarity ± S.E.M. **p < 0.01, ***p < 0.001 compared to control. Data are representative of more than three independent experiments with at least four fish per experimental group. Scale bars = 200 μm. PHENOTYPE:
|

Tmem184a knockdown results in increased endothelial cell proliferation. (A) Example confocal image projecting the third and fourth 4 dpa fin rays. The white circle highlights a point where fluorescence from GFP (green, ECs) H3P (red, Cy3 secondary antibody) overlap and look yellow. Zooming in on this point and rotating in a few different directions confirms nuclear H3P in an EC. (B) Quantitation of H3P/Fli1 ECs in the third and fourth fin rays of 4 dpa standard control, ATG, and SS MO-injected fins compared to third and fourth fin rays of the uninjected side. Graphs are shown as mean percent similarity ± S.E.M. **p < 0.01 compared to control. Data are representative of more than three independent experiments with at least four fish per experimental group. PHENOTYPE:
|
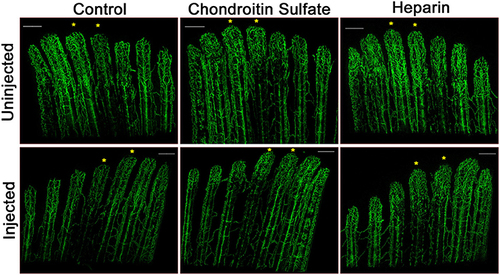
Heparin decreases vascular regeneration. Representative confocal microscopy images of 4 dpa Tg(Fli1:EGFP) fins. Fin rays 3 and 4 of one side of a fin (noted with asterisks) were injected at 3 dpa with either with phenol red (Control), chondroitin sulfate, or heparin, and the other side was left uninjected. A slight decrease in vascular outgrowth and a delay in central artery and vein regeneration are observed in fin rays injected with heparin. Images are representative of three independent experiments with at least three fish per experimental group. Scale bars = 200 μm. PHENOTYPE:
|

ZFIN is incorporating published figure images and captions as part of an ongoing project. Figures from some publications have not yet been curated, or are not available for display because of copyright restrictions. PHENOTYPE:
|