
- Title
-
The 16p11.2 homologs fam57ba and doc2a generate certain brain and body phenotypes
- Authors
- McCammon, J.M., Blaker-Lee, A., Chen, X., Sive, H.
- Source
- Full text @ Hum. Mol. Genet.

ZFIN is incorporating published figure images and captions as part of an ongoing project. Figures from some publications have not yet been curated, or are not available for display because of copyright restrictions. PHENOTYPE:
|
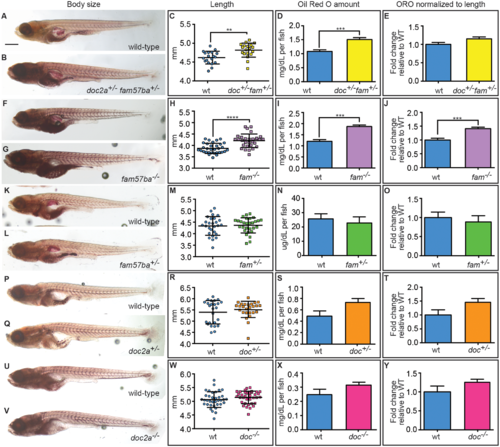
Body size and lipid amounts are affected by doc2a and fam57ba. A representative experiment is shown from the 5 conducted. (A,B) 12 dpf larvae stained with Oil Red O (ORO) are shown for wild-type and doc2a+/− fam57ba+/−. (C) A significant increase in body length as measured from the tip of the nose to the end of the tail is found for doc2a+/− fam57ba+/− larvae (n = 19) compared to wild-type (n = 19). (D) ORO was extracted back out of the stained larvae and quantified, showing a significant increase in the concentration of lipids in the double heterozygotes (yellow bar) compared to wild-type (blue bar). (E) After accounting for length, there is no longer a significant increase in ORO concentration in doc2a+/− fam57ba+/− larvae. (F,G) Wild-type and fam57ba−/− larvae stained with ORO. (H) A significant increase in body length was found comparing fam57ba−/− larvae (n = 30) to wild-type (n = 30). (I) ORO quantification showed a significant increase in the concentration of lipids for fam57ba−/− homozygotes (purple bar) compared to wild-type (blue bar). (J) When accounting for length, ORO concentration is still significantly elevated in fam57ba−/− fish. (K–Y) No significant changes in size or ORO concentration were observed for fam57ba+/− (n = 29), doc2a+/− (n = 26), and doc2a−/− (n = 36) larvae compared to their respective wild-type controls. **P < 0.01, ***P < 0.001, ****P < 0.0001. Scale bar = 500 µm. PHENOTYPE:
|
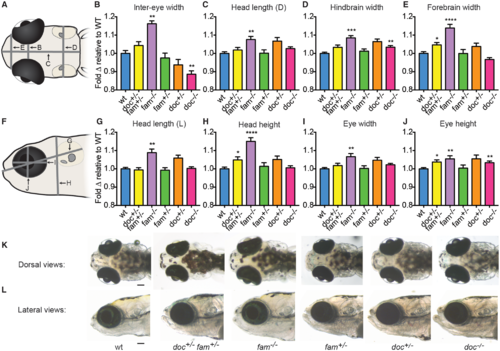
doc2a and fam57ba affect head size. A representative experiment from 4 experiments conducted is shown for each genotype. (A) Dorsal schematic of 12 dpf larval head, with panel letters indicating lines for the 4 measurements taken. (B–E) Fold-change relative to respective wild-type controls (blue bars) is shown for doc2a+/− fam57ba+/− (yellow bars, n = 19), fam57ba−/− (purple bars, n = 19), fam57ba+/− (green bars, n = 29), doc2a+/− (orange bars, n = 26), and doc2a−/− (pink bars, n = 36) larvae for inter-eye width, dorsal head length (D), hindbrain width, and forebrain width. (F) Lateral schematic of 12 dpf larval head, with panel letters indicating the four measurements taken. (G–J) Fold-change relative to respective wild-type controls for each genotype as described above for lateral head length (L), head height, eye width and eye height. (K,L) Live dorsal and lateral images of representative larvae for each genotype. *P < 0.05, **P < 0.01, ***P < 0.001, ****P < 0.0001. Scale bar = 100 μm. PHENOTYPE:
|
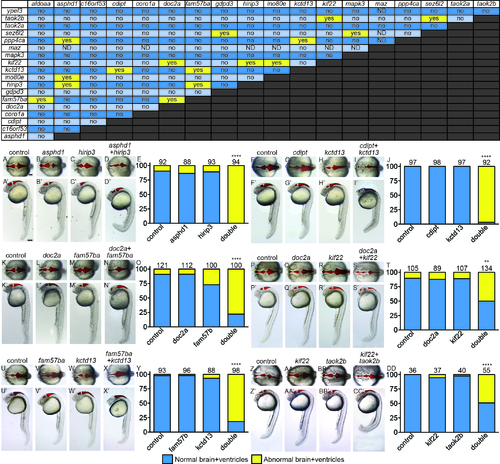
The majority of pairwise combinations of 16p11.2 homologs show no effect on brain and ventricle morphology. Yellow “yes” is a positively interacting pair, “no” is for two genes that do not interact. ND: not determined, because maz interacts with p53, and some genes require p53 MO coinjection. Examples of interacting pairs affecting early brain development. Six of sixteen interacting pairs are shown with dorsal (non-prime letters) and lateral (prime letters). Ventricular space was injected with Texas Red dextran to help visualize morphology. A, F, K, P, U, Z) control MO injected. B, G, L, Q, V, AA) Single LOF for Gene A, balanced with control MO. C, H, M, R, W, BB) Single LOF for Gene B, balanced with control MO. D, I, N, S, X, CC) Double LOF for Genes A and B together. E, J, O, T, Y, DD) Percent of embryos shown on y-axis with normal (blue bars) and abnormal (yellow bars) brain and ventricle shape was quantified, with the total number of embryos for each treatment above the bars. **p<1x10-11, ****p<1X10-15. Scale bars=100 um. PHENOTYPE:
|
|
ZFIN is incorporating published figure images and captions as part of an ongoing project. Figures from some publications have not yet been curated, or are not available for display because of copyright restrictions. |
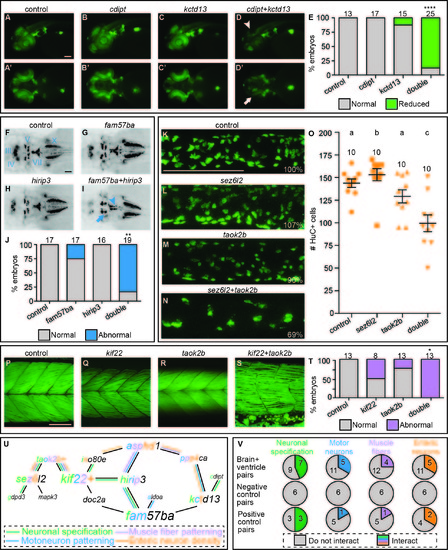
Interacting pairs affect multiple phenotypes in secondary screen. One example of an interacting pair for each of the secondary screen assays. The rest of the interacting pairs are not shown. To evaluate neuronal specification, single and double LOF was induced by injection of MOs into a transgenic NeuroD:GFP line. A-C) Control and single cdipt and kctd13 LOF lateral views exhibit normal levels of NeuroD:GFP expression. A'-C') Ventral views of same embryos. D) Lateral view of double LOF embryo shows reduced expression in the optic tectum (arrowhead). D') Ventral view of double LOF embryo shows reduced expression in the retinal ganglion cells (arrow). E) Percent of embryos with normal (gray bars) and reduced (green bars) expression is quantified with total number of embryos scored above the bars. We analyzed cranial motor neuron patterning using the transgenic islet1:GFP line. F-H) Dorsal views of 2 dpf control and fam57ba and hirip3 single LOF fish exhibit normal patterning of cranial motor neurons in islet1:GFP embryos. I) Double LOF embryos show reduced trigeminal (V, arrow) nerves in the medial-lateral direction, and a misshapen facial (VII, arrowhead) nerve. J) Percent of larvae showing normal (gray) versus abnormal (blue) cranial motor neuron patterning quantified, with total number of larvae imaged shown above each bar. We examined enteric neuron density by antibody staining for the neuronal marker HuC. HuC positive cells were counted in 3D reconstructions of the midintestine at 5 dpf. K-M) Control and sez6l2 and taok2b single LOF images of HuC positive cells in the mid-intestine, with percentages of cells relative to control shown in bottom right corners. N) Double LOF larvae show reduced enteric neuron density. O) Quantification of number of enteric neurons, with each orange point representing a single larva, and total number of larvae assayed above each group. Different letters above each treatment indicate a statistically significant difference of p<0.05 as measured by t-test (Mann-Whitney). Error bars show standard error. We evaluated muscle fiber patterning by phalloidin staining at 5 dpf. Q-R) Single LOF for kif22 and taok2b resemble the control. S) Double LOF larvae show an interaction where muscle fibers are no longer neatly arrayed into chevron shaped segments and instead show looser packing with some fibers crossing muscle boundaries. T) Percent of larvae showing normal (gray) versus abnormal (red) muscle fiber quantified, with total number of larvae imaged shown above each bar. U) Brain and ventricle interaction map overlaid with interactions from secondary screen, lines color coded for each assay, and letters colored in gene names for number of interactions for each assay. V) Number of pairs that interacted in brain and ventricle primary screen interacting in each of secondary assays (top row), negative control pairs (middle row), and positive control pairs (bottom row). *p<0.005, **p<0.0001, ****p<1x10-15. Scale bars=100 um. |
|
ZFIN is incorporating published figure images and captions as part of an ongoing project. Figures from some publications have not yet been curated, or are not available for display because of copyright restrictions. PHENOTYPE:
|
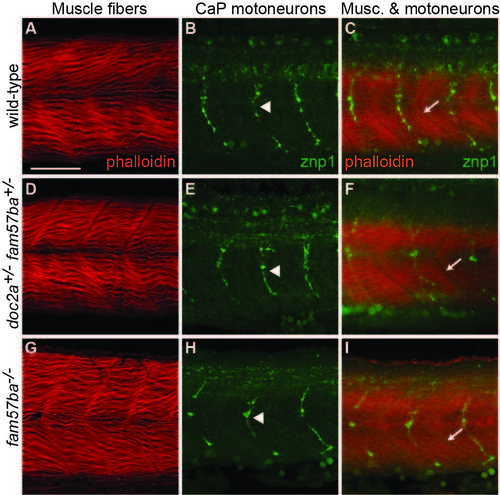
No apparent defects in musculature or primary motoneurons in doc2a+/- fam57ba+/- or fam57ba-/- mutants. A) Muscle fibers in wild-type embryos stained with phalloidin 635. B) Wild-type caudal primary (CaP) motoneurons in a different embryo labeled with znp1 antibody, which binds to synaptotagmin. C) Labeling of both muscle fibers and CaP motoneurons in a different embryo shows one CaP motoneuron axon per muscle segment. Intersegmental boundaries indicated with arrows. D-F) Muscle fibers and CaP motoneurons in doc2a+/- fam57ba+/- double heterozygous embryos show no significant differences from wild-type. G-I) Muscle fibers and CaP motoneurons in fam57ba-/- homozygous mutant embryos show no significant differences from wild-type. |
|
ZFIN is incorporating published figure images and captions as part of an ongoing project. Figures from some publications have not yet been curated, or are not available for display because of copyright restrictions. EXPRESSION / LABELING:
|
|
ZFIN is incorporating published figure images and captions as part of an ongoing project. Figures from some publications have not yet been curated, or are not available for display because of copyright restrictions. PHENOTYPE:
|