
- Title
-
Retinoic acid is required and Fgf, Wnt, and Bmp signaling inhibit posterior lateral line placode induction in zebrafish
- Authors
- Nikaido, M., Acedo, J.N., Hatta, K., Piotrowski, T.
- Source
- Full text @ Dev. Biol.
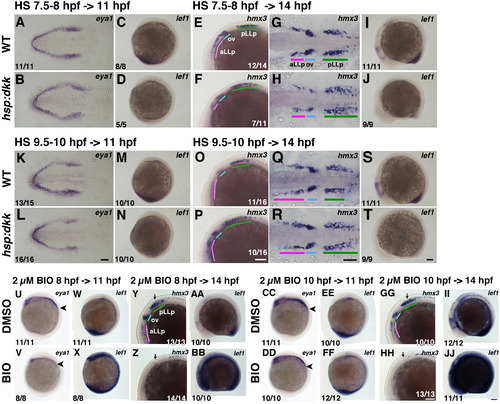
Loss of Wnt signaling expands the pLLp, whereas Wnt activation inhibits the pLLp. Suppression and activation of Wnt activity using Tg(hsp:dkk-gfp) (A-T) and BIO (U-Z, AA-JJ), respectively. Duration of the heat shock (37 °C, 30 min) and timing for fixation are indicated on the top-left of pictures. Durations of BIO treatment are shown on top of pictures. BIO treated embryos were fixed just after incubation. Genotypes for all embryos in the same row are shown on the left, as are the drugs used (0.5% DMSO, 2 µM BIO). Numbers in the bottom-rigft (E, F, O, P, Y, Z, GG, HH) or left (the rest) indicate the number of embryos with the phenotype shown in the panel out of the total number of examined embryos. In all panels anterior is to the left. (A, B, K, L) Flat-mounted embryos at 11 hpf stained with eya1. (G, H, Q, R) Flat-mounted embryos at 14 hpf stained with hmx3. (C, D, M, N, U-X, CC-FF) Lateral views of 11 hpf embryos. Anterior is on top. (E, F, I, J, O, P, S, T, Y, Z, AA, BB, GG-JJ) Lateral views of 14 hpf embryos. Colored bars indicate the positions of the aLLp, otic vesicle and pLLp. Abbreviations: aLLp: anterior lateral line placode, ov: otic vesicle, pLLp: posterior lateral line placode. Black arrowheads in (U, V, CC, DD) indicate the posterior end of eya1 expression areas. Black arrows in (Y, Z, GG, HH) mark the positions of the pLLp. Scale bars: 100 µm. |
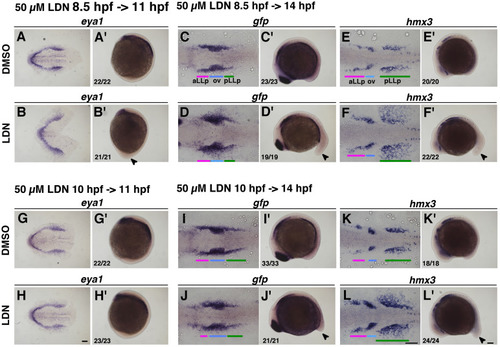
Removal of Bmp activity leads to expansion of the pLLp. Duration of the inhibitor treatment is indicated on the top-left for pictures. The concentration of DMSO was 0.5% and 50 µM of LDN193189. After drug treatment embryos were immediately fixed and subjected to in situ hybridization. Numbers in the bottom-left indicate number of embryos showing the phenotype out of all examined embryos. (A-F, A’-F’) Inhibitor treatment started at 8.5 hpf (80% epiboly) stages. (G-L, G’-L’) Inhibitor treatment started at 10 hpf stages. (A, B, G, H) Flat-mounted embryos at 11 hpf stained with eya1. Anterior to the left. (C-F, I-L) Flat-mounted embryos at 14 hpf stained with gfp or hmx3. Anterior to the left. (A’-L’) Lateral views of 11 hpf (A’, B’, G’, H’) and 14 hpf (C’-F’, I’-L’) embryos stained with eya1 (A’, B’, G’, H’), gfp (C’, D’, I’, J’) and hmx3 (E’, F’, K’, L’). Anterior is oriented to the top for A’, B’, G’, H’, whilst anterior to the left for C’-F’, I’-L’. Arrowheads indicate elongated tail bud induced by LDN193189 treatment. Colored bars indicate the positions of the aLLp, otic vesicle and pLLp. Abbreviations: aLLp: anterior lateral line placode, ov: otic vesicle, pLLp: posterior lateral line placode. Scale bars: 100 µm. |
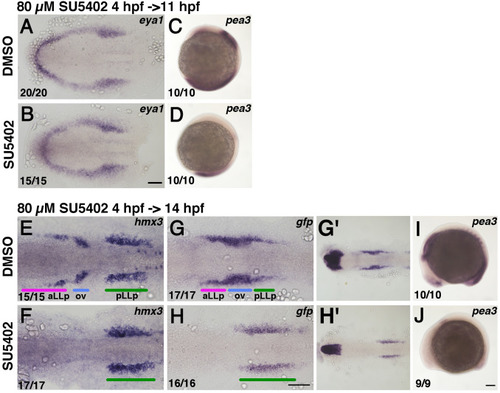
Inhibition of Fgf activity suppresses aLLp formation but expands the pLLp. Duration of the inhibitor treatment and timing for fixation are indicated on the top-left of a group of pictures. After drug treatment embryos were immediately fixed and subjected to in situ hybridization. The drugs used (0.8% DMSO or 80 µM SU5402) are shown on the left. Numbers in the bottom-left indicate numbers of embryos showing the phenotype. (A, B) Flat-mounted embryos at 11 hpf stained with eya1. Anterior to the left. (E-H, G’, H’) Flat-mounted embryos at 14 hpf stained with hmx3 (E, F) and gfp (G, H, G’, H’). G’ and H’ are lower magnification views of G and H, respectively. Anterior to the left. (C, D, I, J) Lateral views of 11 hpf (C, D) and 14 hpf (I, J) embryos stained with pea3. Anterior is oriented to the top for C, D, whilst anterior to the left for I, J. Colored bars indicate the positions of the aLLp, otic vesicle and pLLp. Abbreviations: aLLp: anterior lateral line placode, ov: otic vesicle, pLLp: posterior lateral line placode. Scale bars: 100 µm. |
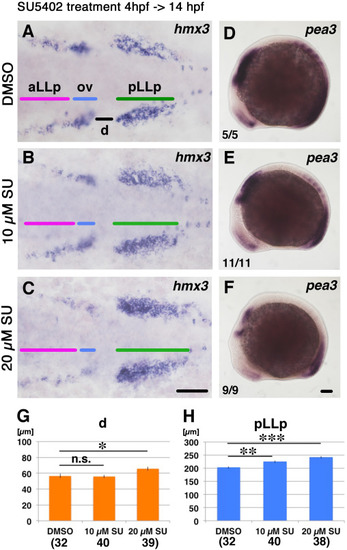
The aLLp is reduced and not fused to the pLLp after loss of Fgf signaling. Duration of the inhibitor treatment and timing for fixation for A-F are indicated on the top-left. After drug treatment embryos were fixed and subjected to in situ hybridization. Drugs for treatment (0.5% DMSO or SU5402) are shown on the left. Numbers in the bottom-left of D-F indicate numbers of embryos showing the phenotype. (A-C) Flat-mounted embryos at 14 hpf stained with hmx3. Anterior to the left. (D-F) Left-side views of 14 hpf embryos stained with pea3. Anterior to the left. Scale bars: 100 µm. (G, H) Measurement of lengths indicated in panel (A), d and pLLp. Concentration of drug and numbers of hmx3 expression domains examined are shown below each bar. *: p<0.05, **: p<0.01, ***: p<0.001. n.s. is “not significant”. Colored bars indicate the positions of the aLLp, otic vesicle and pLLp. Abbreviations: aLLp: anterior lateral line placode, ov: otic vesicle, pLLp: posterior lateral line placode. |

Removal of RA activity before 10 hpf suppresses pLLp formation but does not affect aLLp formation. (A-T) Duration of the inhibitor treatments and timing for fixation are indicated on the top-left of a group of pictures. After drug treatment embryos were immediately fixed and subjected to in situ hybridization. Drugs for treatment (0.5% DMSO or 10 µM DEAB) are shown on the left. Numbers in the bottom-left indicates numbers of embryos showing the phenotype. (A, B, K, L) Flat-mounted embryos at 11 hpf stained with eya1. Anterior to the left. (E-H, O-R) Flat-mounted embryos at 14 hpf stained with hmx3+pax2a (E, F, O, P) and gfp+pax2a (G, H, Q, R). Anterior to the left. (C, D, I, J, M, N, S, T) Lateral views of 11 hpf (C, D, M, N) and 14 hpf (I, J, S, T) embryos stained with hoxb1b. Anterior is oriented to the top for C, D, M, N, whilst anterior to the left for I, J, S, T. Black and white arrowheads indicate the anterior edge of the neural hoxb1b expression. (U-Z) Longer incubation with DEAB until 24 hpf. Durations for incubation are indicated on top of a pair of pictures in the same column. Drugs treated (0.5% of DMSO and 50 µM of DEAB) are on the left side. Colored bars indicate the positions of the aLLp, otic vesicle and pLLp. Abbreviations: aLLp: anterior lateral line placode, ov: otic vesicle, pLLp: posterior lateral line placode. Scale bars: 100 µm. |
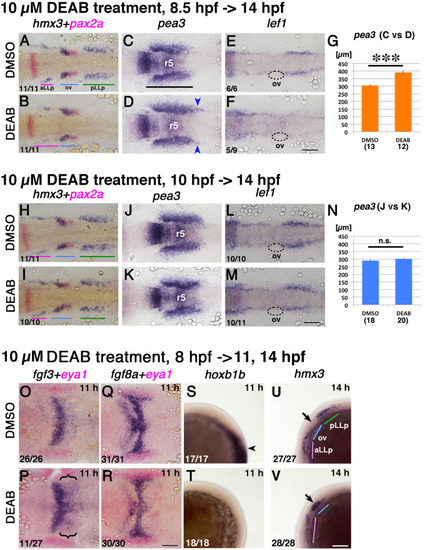
Loss of RA activity leads to the posterior expansion of the Fgf signaling domain. Duration of the inhibitor treatments and timing of fixations are indicated on the top-left for A-G, H-N and O-V, although the embryos shown in (O-T) and ones in (U, V) were fixed at different timing. Developmental stages for fixation for O-V are shown in the top-right corners. After drug treatment embryos were immediately fixed and subjected to in situ hybridization<. Drugs for treatment (0.5% DMSO or 10 µM DEAB) are shown on the left. Numbers in the bottom-left indicate numbers of embryos showing the phenotype. (A-F, H-M) Flat-mounted embryos at 14 hpf stained with hmx3+pax2a (A, B, H, I), stained with pea3 (C, D, J, K) and stained with lef1 (E, F, L, M). pax2a marks the otic vesicles in red. Anterior is to the left. (G, N) Quantifications of pea3 expression domains in (C, D, J, K) (e.g. black bar in C). DEAB treatment from the 80% epiboly stage causes significant (p<0.001) elongation of the pea3 domains (G), whilst treatment starting at 10 hpf does not (N). Numbers of pea3 expression domains measured are indicated below each bar. (O-R) The hindbrain area of flat-mounted embryos at 11 hpf stained with fgf3+eya1 (O, P) and fgf8a+eya1 (Q, R). eya1 marks the PPR in red in these panels. Anterior is to the left. (S-V) Lateral views of 11 hpf (S, T) and 14 hpf (U, V) embryos stained with hoxb1b and hmx3, respectively. Anterior is oriented to the top in S, T, whilst anterior is to the left in U, V. Blue arrowheads mark elongated part of pea3 expression domains. Black arrowheads indicates the anterior edge of the neural hoxb1b expression, and black arrows mark the position of the ear. hmx3 expression in the ear is posteriorly expanded as also observed in B. Colored bars indicate the positions of the aLLp, otic vesicle and pLLp. Abbreviations: aLLp: anterior lateral line placode, ov: otic vesicle, pLLp: posterior lateral line placode, r5: rhombomere 5. Scale bars: 100 µm. |
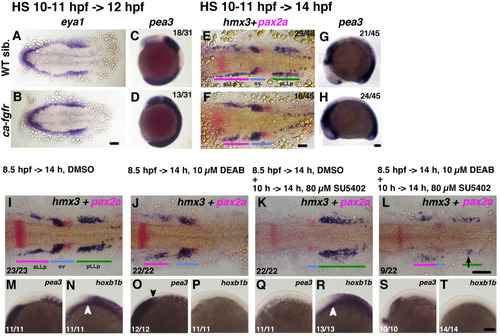
Loss of retinoic acid suppresses pLLp formation via the activation of Fgf signaling. The duration of the heat shock to activate Fgf signaling and timing for fixation are indicated on the top-left for (A-D), and for (E-H). Condition for heat shock is “39 °C for 20 min ->room temperature for 20 min ->39 °C for 20 min”. After fixation embryos are subjected to in situ hybridization. Numbers of embryos showing this expression pattern are indicated in the top-right corners. The larger number is the number of all embryos, not the number of embryos transgenic for CA-FgfR1. Because the transgenic parental fish were heterozygous, and we crossed them with wild type, we expected a ratio of transgenic embryos of 50%. A, B, E, F are flat-mounted embryos at 12 hpf (A, B) and 14 hpf (E, F) stained with eya1 and hmx3+pax2a, respectively. Anterior to the left. C, D, G, H are the lateral side views of 12 hpf (C, D) and 14 hpf (G, H) embryos stained with pea3. Anterior is to the top in C, D, and to the left in G, H. (I-T) Rescue experiments with the Fgf inhibitor SU5402. Duration of the drug treatment (0.9% DMSO, 10 µM DEAB, 80 µM SU5402) is indicated on the top. I-L are flat-mounted embryos at 14 hpf stained with hmx3+pax2a. M-T are left-side views of 14 hpf embryos stained with pea3 (M, O, Q, S) and hoxb1b (N, P, R, T). White arrowheads indicate the anterior edge of the neural hoxb1b expression, and the black one points at the posterior extension of pea3 in (O). Black arrow in (L) marks rescued hmx3 expression. Colored bars indicate the positions of the aLLp, otic vesicle and pLLp. Abbreviations: aLLp: anterior lateral line placode, ov: otic vesicle, pLLp: posterior lateral line placode. Scale bar: 100 µm. |
Reprinted from Developmental Biology, 431(2), Nikaido, M., Acedo, J.N., Hatta, K., Piotrowski, T., Retinoic acid is required and Fgf, Wnt, and Bmp signaling inhibit posterior lateral line placode induction in zebrafish, 215-225, Copyright (2017) with permission from Elsevier. Full text @ Dev. Biol.