
- Title
-
CNS-resident progenitors direct the vascularization of neighboring tissues
- Authors
- Matsuoka, R.L., Rossi, A., Stone, O.A., Stainier, D.Y.R.
- Source
- Full text @ Proc. Natl. Acad. Sci. USA
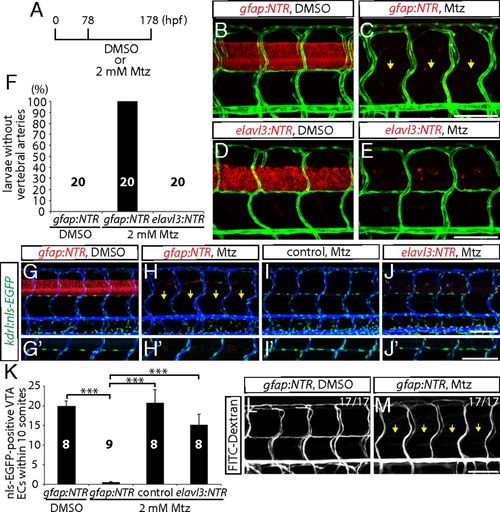
Genetic ablation of CNS radial glia in early larval stages leads to a complete loss of the VTAs. (A) Experimental time course for B–E, G–J, L, and M. (B–E) 178 hpf Tg(gfap:NTR) (B and C) and Tg(elavl3:NTR) (D and E) trunk vasculature visualized by Tg(kdrl:EGFP) expression after treatment with DMSO (B and D) or Mtz (C and E). Genetic ablation of radial glia, but not of neurons, leads to the loss of the VTAs (yellow arrows, C). (F) Percentage of larvae without VTAs, as judged by Tg(kdrl:EGFP) expression (10 somites examined per animal). (G–J) 178 hpf Tg(gfap:NTR) (G and H), control (I), and Tg(elavl3:NTR) (J) animals carrying the kdrl:nls-EGFP transgene, which were injected with Q-dot 655 nanocrystals after treatment with DMSO (G) or Mtz (H–J). Radial glia-ablated fish lack ECs in the position of the VTAs (yellow arrows, H). High-magnification images of ECs in the position of the VTAs are shown in G′–J′. (K) Quantification of nls-EGFP+ EC number in the position of the VTAs within 10 somites per animal. Values represent means ± SEM, ***P < 0.001. (L and M) 178 hpf Tg(gfap:NTR) trunk vasculature visualized by FITC-dextran microangiography after treatment with DMSO (L) or Mtz (M). Radial glia ablation leads to a loss of lumenized VTAs (yellow arrows, M). (Scale bar, 100 µm.) |

VTAs serve as critical scaffolds for subsequent vascularization around and within the spinal cord. (A–D) TgBAC(gfap:gfap-EGFP);Tg(kdrl:ras-mcherry) trunks at 76 (A), 102 (B), 124 (C), and 154 (D) hpf show a developmental time course of VTA formation. (E and F–F″) A 154 hpf TgBAC(gfap:gfap-EGFP);Tg(kdrl:ras-mcherry) trunk (E) and its sections counterstained with DAPI (F–F″). Radial glia endfeet and VTAs are physically adjacent (white arrows). High-magnification image of the region inside the dashed line (F′) is shown in F″. (G–I) Tg(kdrl:EGFP) trunk vasculature at different developmental stages. At 7 dpf, most VTAs are formed (G, yellow arrows). At 11 dpf, sprouting vessels emerge between dorsal ISVs (H, yellow arrows), and these vessels have established connections with neighboring VTAs or ISVs by 15 dpf (I). (J) High-magnification image of Tg(kdrl:EGFP) trunk vasculature at 18 dpf. Vessels around the spinal cord are connected to VTAs (yellow arrows). (K and L) z-stack projection images of 25 dpf Tg(kdrl:EGFP) trunk vasculature. Blood vessels inside the spinal cord are shown in magenta. Pink arrows point to the sites where angiogenic sprouting into the spinal cord takes place. It mostly occurs from the dorsolateral sides of the PNVP. (M–O) Tg(gfap:NTR);Tg(kdrl:EGFP) trunk sections at different developmental stages. At 15 dpf, blood vessels are not observed inside the spinal cord (M). Blood vessel invasion into the spinal cord is observed by 20 dpf (N). Increased number and density of spinal cord vessels are observed at 30 dpf (O). (Scale bars, 100 µm in D and G–K, 50 µm in E and M–O, and 20 µm in F and F′.) EXPRESSION / LABELING:
|

Vegfab/Vegfr2 signaling is required for VTA formation. (A–D) 152 hpf Tg(kdrl:ras-mcherry) trunk vasculature after treatment with DMSO (A), Sunitinib (B), SKLB1002 (C), or LY294002 (D) starting at 80 hpf. Sunitinib, SKLB1002, and LY294002 treatments significantly inhibit VTA formation (yellow arrows). (E–H) 178 hpf Tg(hsp70l:sflt1) (E and F), control (G), and Tg(hsp70l:sflt4) (H) trunk ECs visualized by Tg(kdrl:nls-EGFP) expression. Larvae were subjected to no heat shock (HS) (E) or multiple heat shocks (F–H). High-magnification images of ECs in the position of the VTAs are shown in E′–H′. Overexpression of sFlt-1 leads to a significantly reduced number of ECs in the position of the VTAs (yellow arrows, F). (I) Quantification of the average number of somites with VTAs for the experiments A–D (20 somites examined per animal). (J) Quantification of nls-EGFP+ EC number in the position of the VTAs within 10 somites per animal for the experiments E–H. (K and L) 8 dpf TgBAC(etv2:EGFP) vegfab+/+ (K) and vegfab−/− (L) trunk vasculature. All vegfab−/− larvae examined (n = 20) lacked VTAs (yellow arrows). (M) Percentage of larvae without VTAs, as judged by TgBAC(etv2:EGFP) expression. Values represent means ± SEM (I and J), **P < 0.01 and ***P < 0.001. (Scale bar, 100 µm.) EXPRESSION / LABELING:
PHENOTYPE:
|

vegfab is expressed by radial glia, and radial glia-ablated fish as well as vegfab mutants fail to develop a PNVP around the spinal cord. (A and B) Whole-mount in situ hybridization for vegfab expression in 80 hpf Tg(gfap:NTR) larvae treated with DMSO (A) or Mtz (B) starting at 30 hpf. High-magnification images of the trunk regions and their cryosections are shown in (A′ and B′) and (A″ and B″), respectively. Mtz-treated fish show decreased vegfab transcripts in the spinal cord compared with DMSO-treated fish. (C) Schematic diagram of the plasmid injection experiments (D–D″). (D–D″) 105 hpf Tg(UAS:mcherry-MA);Tg(gfap:GFP) trunk of fish injected with the vegfab BAC plasmid that drives Gal4ff. Injection of the plasmid drives mCherry expression in cells within the spinal cord (D′), which are also positive for Tg(gfap:GFP) expression (D). Most mCherry+ cells are also GFP+ (D″, yellow arrows). (E–I) 11 dpf Tg(gfap:NTR) trunk vasculature after treatment with DMSO (E) or Mtz (F) starting at 9 dpf; 11 dpf TgBAC(etv2:EGFP) vegfab−/− (G), Tg(kdrl:EGFP);Tg(hsp70l:sflt1) (H), and Tg(kdrl:EGFP);Tg(hsp70l:sflt4) (I) trunk vasculature after heat shocks (H and I). DMSO-treated control fish display vessels that emerge between dorsal ISVs around the spinal cord; however, vessel formation is severely impaired in radial glia-ablated larvae as well as in vegfab−/− animals. Overexpression of sFlt1 also blocked PNVP formation. (J) Quantification of the average number of somites with peri-neural blood vessels (10 somites examined per animal). Values represent means ± SEM, ***P < 0.001. (Scale bars, 200 µm in B–B″, 100 µm in E, and 20 µm in D″.) EXPRESSION / LABELING:
PHENOTYPE:
|
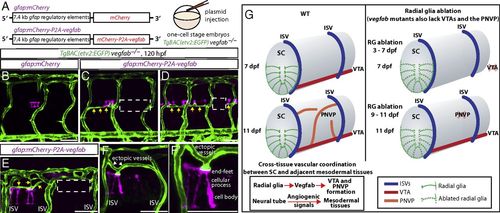
Mosaic overexpression of Vegfab in radial glia is sufficient to partially rescue the loss of VTAs in vegfab mutants and induce ectopic blood vessels directed toward their endfeet. (A) Schematic diagram of the gfap:mCherry and gfap:mCherry-P2A-vegfab plasmid injection experiments (B–F′). (B–F′) 120 hpf TgBAC(etv2:EGFP) trunks of vegfab−/− fish injected with the gfap:mCherry (B) or gfap:mCherry-P2A-vegfab (C–F′) plasmid. Partial recovery of VTAs was observed in the vegfab−/− fish injected with the gfap:mCherry-P2A-vegfab plasmid (yellow arrows, C and D), while VTAs were absent in the vegfab−/− fish injected with the gfap:mCherry plasmid (B). As observed in the regions inside the dashed lines (C and D), VTAs were absent in the somites where mCherry+ radial glia were not present in close proximity and/or sufficient numbers. Ectopic blood vessel sprouting toward mCherry+ radial glia overexpressing Vegfab (yellow arrows, E) was not observed in somites lacking mCherry+ radial glia (e.g., the region inside the dashed white line in E). Ectopic vessels (white arrows) were directed toward the endfeet of mCherry+ radial glia overexpressing Vegfab (F and F′). (Scale bar, 50 µm.) (G) Schematic diagrams showing radial glia regulation of angiogenesis around the developing spinal cord. During development, radial glia endfeet lie in close proximity to the forming VTAs. Radial glia ablation in early larval stages leads to the loss of the VTAs. Radial glia ablation at later stages impairs PNVP formation. vegfab mutants phenocopy the vascular defects observed in radial glia-ablated larvae. Thus, radial glia act as positive angiogenic regulators in mesodermal tissues around the spinal cord, which in turn allows spinal cord vascularization. Vessels are shown only on one side of the spinal cord. RG, radial glia; SC, spinal cord. |
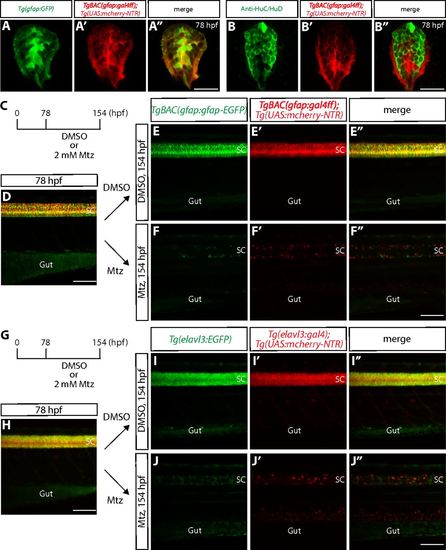
Radial glia and neuronal ablation by the NTR/Mtz-mediated cell ablation method. (A–A″) 78 hpf Tg(gfap:GFP);TgBAC(gfap:gal4ff);Tg(UAS:mcherry-NTR) trunk spinal cord section. GFP+ radial glia and mCherry+ cells are largely colocalized. (B–B″) 78 hpf TgBAC(gfap:gal4ff);Tg(UAS:mcherry-NTR) trunk spinal cord section immunostained for HuC/HuD (green). EGFP+ neurons and mCherry+ cells are mostly distinct. (C) Time course of NTR/Mtz-mediated cell ablation of radial glia for D–F″. (D) 78 hpf TgBAC(gfap:gfap-EGFP);TgBAC(gfap:gal4ff);Tg(UAS:mcherry-NTR) trunk. TgBAC(gfap:Gfap-EGFP) expression and TgBAC(gfap:gal4ff);Tg(UAS:mCherry-NTR) expression are observed in the spinal cord in an overlapping manner. SC, spinal cord. (E–E″ and F–F″) 154 hpf TgBAC(gfap:gfap-EGFP);TgBAC(gfap:gal4ff);Tg(UAS:mcherry-NTR) trunk after treatment with DMSO (E–E″) or Mtz (F–F″) starting at 78 hpf. Unlike DMSO-treated fish that show strong coexpression of TgBAC(gfap:Gfap-EGFP) and TgBAC(gfap:gal4ff);Tg(UAS:mCherry-NTR) in their spinal cord, Mtz-treated fish show a dramatic reduction of this coexpression. (G) Time course of NTR/Mtz-mediated cell ablation of neurons for H–J″. (H) 78 hpf Tg(elavl3:EGFP);Tg(elavl3:gal4);Tg(UAS:mcherry-NTR) trunk. Tg(elavl3:EGFP) expression and Tg(elavl3:gal4);Tg(UAS:mCherry-NTR) expression are observed in the spinal cord in an overlapping manner. (I–I″ and J–J″) 154 hpf Tg(elavl3:EGFP);Tg(elavl3:gal4);Tg(UAS:mcherry-NTR) trunk after treatment with DMSO (I–I″) or Mtz (J–J″) starting at 78 hpf. Unlike DMSO-treated fish that show strong coexpression of Tg(elavl3:EGFP) and Tg(elavl3:gal4);Tg(UAS:mCherry-NTR) in their spinal cord, Mtz-treated fish show a dramatic reduction of this coexpression. (Scale bars, 100 µm in D, F″, H, and J″ and 20 µm in A″ and B″.) |

Ablation of oligodendrocytes, oligodendrocyte precursor cells, or microglia does not lead to a loss of VTAs; specificity of radial glia and neuronal ablation by the NTR/Mtz-mediated cell ablation method. (A and B) 178 hpf Tg(sox10:EGFP);Tg(kdrl:ras-mcherry) trunk after treatment with DMSO (A) or 50 µM cyclopamine (B) from 34 to 52 hpf. The loss of VTA phenotype observed after radial glia ablation is not seen in fish treated with cyclopamine, which show a dramatically reduced number of spinal cord oligodendrocytes and oligodendrocyte precursor cells (B). (C and D) 178 hpf Tg(mbpa:NTR);Tg(kdrl:EGFP) larval trunk after treatment with DMSO (C) or Mtz (D) from 78 to 178 hpf. Genetic ablation of oligodendrocytes does not lead to a loss of VTAs (D). (E and F) 178 hpf Tg(kdrl:EGFP) irf8+/+ (E) and irf8−/− (F) trunk vasculature. The loss of VTA phenotype observed after radial glia ablation is not seen in irf8−/− fish (F). (G) Experimental time course of NTR/Mtz-mediated cell ablation for H–K″. (H–H″ and I–I″) 154 hpf TgBAC(gfap:gfap-EGFP);Tg(elavl3:gal4);Tg(UAS:mcherry-NTR) trunk after treatment with DMSO (H–H″) or Mtz (I–I″) starting at 78 hpf. Mtz-treated fish show a dramatic reduction of Tg(elavl3:gal4);Tg(UAS:mCherry-NTR) expression in their spinal cord (I′), however TgBAC(gfap:Gfap-EGFP) expression appears unaffected (I) compared with DMSO-treated fish (H). (J–J″ and K–K″) 154 hpf Tg(elavl3:EGFP);TgBAC(gfap:gal4ff);Tg(UAS:mcherry-NTR) trunk after treatment with DMSO (J–J″) or Mtz (K–K″) starting at 78 hpf. Mtz-treated fish show a dramatic reduction of TgBAC(gfap:gal4ff);Tg(UAS:mCherry-NTR) expression in their spinal cord (K′). In contrast, Tg(elavl3:EGFP) expression is slightly, but not dramatically, reduced (K) compared with DMSO-treated fish that show strong expression of both TgBAC(gfap:gal4ff);Tg(UAS:mCherry-NTR) and Tg(elavl3:EGFP) expression in their spinal cord (J–J″). (Scale bar, 100 µm.) |

Characterization of VTAs and the PNVP. (A–A″) 8 dpf Tg(kdrl:EGFP);Tg(-0.8flt1:tdTomato) trunk vasculature. Vessels that exhibit strong Tg(-0.8flt1:tdTomato) expression comprise those of arterial identity, and VTAs also show strong Tg(-0.8flt1:tdTomato) expression (white arrows). (B–B″) 8 dpf Tg(kdrl:EGFP);Tg(lyve1:DsRed) trunk vasculature. Vessels that show Tg(lyve1:DsRed) expression comprise those of venous and lymphatic identity, and VTAs are not positive for Tg(lyve1:DsRed) expression (white arrows). (C) Percentage of VTAs that show strong Tg(-0.8flt1:tdTomato) expression at 8 dpf (132 VTAs quantified in 12 fish). All of the VTAs examined at 8 dpf show strong Tg(-0.8flt1:tdTomato) expression. (D and E) 11 dpf Tg(kdrl:EGFP) larval trunk vasculature. Sprouting vessels in the dorsal trunk emerge from ISVs or VTAs (yellow arrows). (F) High-magnification image of Tg(kdrl:EGFP) trunk vasculature at 15 dpf. Vessels that emerge around the spinal cord are connected to the VTAs (yellow arrows). (Scale bar, 100 µm.) |
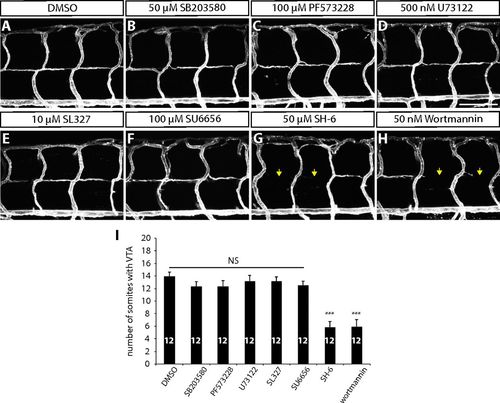
VTA formation in larvae treated with different small-molecule inhibitors. (A–H) 152 hpf Tg(kdrl:ras-mcherry) larval trunk vasculature after treatment with DMSO (A), SB203580 (B), PF573228 (C), U73122 (D), SL327 (E), SU6656 (F), SH-6 (G), and wortmannin (H) from 80 to 152 hpf. SH-6 and wortmannin treatments significantly inhibited VTA formation (yellow arrows). (Scale bar, 100 µm.) (I) Quantification of the average number of somites with VTAs for the experiments shown in A–H (20 somites examined per animal). Values represent means ± SEM (***P < 0.001 by ANOVA followed by Tukey’s HSD test). PHENOTYPE:
|

VTA formation in vegfaabns1, vegfabbns92, and vegfchu6410 mutants. (A) Predicted domain structure of WT Vegfab isoforms -171, -210, and Vegfabbns92. Vegfab-171 and -210 consist of a signal peptide (SP), a knot motif, and heparin (Hep) and/or Hep/Nrp1 (Nrp) binding domains. vegfabbns92 encodes a truncated peptide (p.Met88Trpfs*18). (B and C) 8 dpf Tg(hsp70l:vegfaa165) vegfaa−/− (B) and vegfc−/− (C) larval trunk vasculature visualized by Tg(kdrl:EGFP) expression. Tg(hsp70l:vegfaa165) vegfaa−/− embryos were heat-shocked at 10 and 24 hpf to rescue their early vascular phenotype. VTAs are present in all of the vegfaa−/− (B; n = 11) and vegfc−/− (C; n = 10) larvae examined. (D and E) 8 dpf vegfab+/+ (D) and vegfab−/− (E) larval trunk vasculature visualized by FITC-dextran microangiography. vegfab−/− larvae lack lumenized VTAs (yellow arrows, E). |
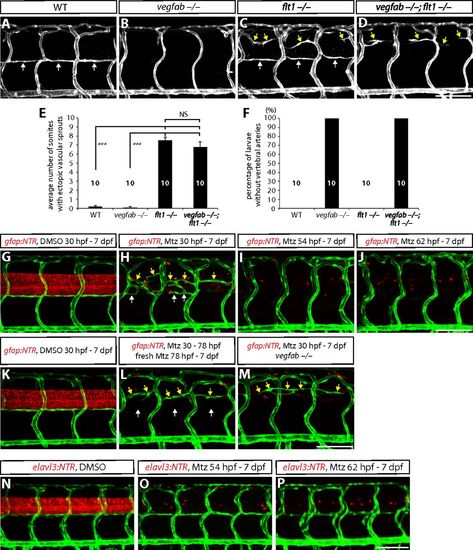
Ectopic ISV sprouting and VTA formation defects in larvae lacking flt1, vegfab, and/or radial glia. (A–D) 7 dpf WT (A), vegfabbns92/bns92 (B), flt1bns29/bns29 (C), and vegfabbns92/bns92;flt1bns29/bns29 (D) larval trunk vasculature visualized by TgBAC(etv2:EGFP) expression. VTAs are indicated by white arrows, ectopic vascular sprouts by yellow arrows. (E) Quantification of average number of somites that showed ectopic blood vessels in WT, vegfabbns92/bns92, flt1bns29/bns29, and vegfabbns92/bns92;flt1bns29/bns29 larvae (10 somites examined per animal; 10 animals examined per genotype). Values represent means ± SEM (*** indicates P < 0.001 by ANOVA followed by Tukey's HSD test). (F) Percentage of larvae without VTAs, as judged by TgBAC(etv2:EGFP) expression. All of the vegfab−/− and vegfab−/−;flt1−/− larvae lack VTAs. (G–J) 7 dpf Tg(gfap:NTR);Tg(kdrl:EGFP) animals that were treated with DMSO or Mtz starting at different developmental stages. Fish were treated with DMSO from 30 hpf to 7 dpf (G) or Mtz from 30 hpf to 7 dpf (H), 54 hpf to 7 dpf (I), or 62 hpf to 7 dpf (J). VTAs were completely absent in radial glia-ablated animals treated with Mtz from 54 hpf to 7 dpf (I) and 62 hpf to 7 dpf (J). VTAs were not correctly formed in radial glia-ablated animals treated with Mtz from 30 hpf to 7 dpf (H), yet vessels (white arrows) were occasionally observed near where VTAs usually form, in addition to ectopically sprouting vessels (yellow arrows) between the dorsal ISVs. (K and L) 7 dpf Tg(gfap:NTR);Tg(kdrl:EGFP) trunk vasculature after treatment with DMSO from 30 hpf to 7 dpf (K) or Mtz from 30 to 78 hpf followed by treatment with freshly prepared Mtz from 78 hpf to 7 dpf (L). Under these Mtz treatment conditions, a more complete ablation of radial glia was achieved (L) compared with the Mtz treatment shown in H. Although ectopic ISV sprouting was observed (yellow arrows, L), VTAs were absent under these Mtz treatment conditions (white arrows, L). (M) 7 dpf Tg(gfap:NTR);Tg(kdrl:EGFP) vegfab−/− trunk vasculature after treatment with Mtz from 30 hpf to 7 dpf. Although ectopic ISV sprouting was observed (yellow arrows), VTAs were absent in the radial glia-ablated vegfab−/− animal (M). This phenotype is similar to that observed in vegfabbns92/bns92;flt1bns29/bns29 larvae (D). (N–P) 7 dpf Tg(elavl3:NTR);Tg(kdrl:EGFP) animals that were treated with DMSO or Mtz starting at different developmental stages. Fish were treated with DMSO from 30 hpf to 7 dpf (N), or Mtz from 54 hpf to 7 dpf (O), or 62 hpf and 7 dpf (P). Unlike radial glia-ablated animals, Mtz-induced neuronal ablation starting at different developmental stages did not lead to a defect in trunk vascular patterning. (Scale bar, 100 µm.) PHENOTYPE:
|

Trunk vascular patterning in 15 different radial glia-ablated animals after treatment with Mtz from 30 to 154 hpf. 154 hpf Tg(gfap:NTR);Tg(kdrl:EGFP) animals were treated with Mtz from 30 to 154 hpf. Confocal images were taken using a 20× (A–O) or 40× (A′–O′) objective lens. The region inside the dashed line in A is shown in A′, and the other 40× images (B′–O′) also correspond to the area that covers the four posterior ISVs shown in B–O. VTA formation was affected in all of the animals examined, although vessels were occasionally, and variably, observed in positions where VTAs usually form. Left to right in each image: anterior to posterior parts of the trunk. (Scale bar, 100 µm.) |

Ablation of neurons, oligodendrocytes, or microglia does not lead to compromised PNVP formation; specific expression of gfap:mCherry-P2A-Vegfab in Tg(gfap:GFP)+ radial glia. (A–D) 11 dpf Tg(kdrl:EGFP) (A), Tg(elavl3:NTR);Tg(kdrl:EGFP) (B), and Tg(mbpa:NTR);Tg(kdrl:EGFP) (C) larval trunk vasculature after treatment with Mtz from 9 to 11 dpf. 11 dpf Tg(kdrl:EGFP) irf8−/− trunk vasculature is shown in D. Mtz-treated control fish (A) as well as larvae in which neurons (B), oligodendrocytes (C), or microglia (D) were depleted exhibit vessels (white arrows) that emerge between the dorsal ISVs around the spinal cord. (E) Quantification of the average number of somites with peri-neural blood vessels (10 somites examined per animal). Quantification was performed at 11 dpf. Values represent means ± SEM. (F–F″) 105 hpf trunk of Tg(gfap:GFP) fish injected with the gfap:mCherry-P2A-vegfab plasmid. Injection of the gfap:mCherry-P2A-vegfab plasmid drives mCherry expression in cells within the spinal cord (F′), which are also positive for Tg(gfap:GFP) expression (F). All mCherry+ cells are also GFP+ (F″). (Scale bars, 100 µm in A and 50 µm in F″.) |