
- Title
-
Insm1a Is Required for Zebrafish Posterior Lateral Line Development.
- Authors
- He, Y., Lu, X., Qian, F., Liu, D., Chai, R., Li, H.
- Source
- Full text @ Front. Mol. Neurosci.
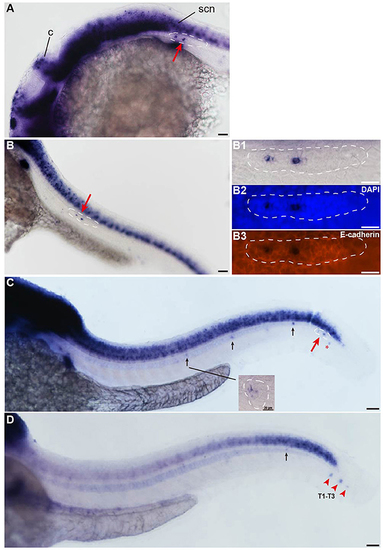
Insm1a is expressed in the developing pLL system. (A–D) Expression of insm1a detected by whole-mount in situ hybridization (WISH) in embryos at 24 hpf (A), 30 hpf (B), 48 hpf (C), and 72 hpf (D). Insm1a is expressed in the pLL system (Lateral view). (B1–B3) The right column of (B) shows the pLLp at higher magnification. The primordia are outlined with dotted lines and indicated by red arrows, and the neuromasts are indicated by black arrows. The red arrowheads in (D) indicate the terminal neuromasts (T1-T3), and the red asterisk in (C) indicates the primordium on the other side of the zebrafish. c, cerebellum; scn, spinal cord neuron. In all figures, scale bars are 50 μm, except the higher magnification image in (C), where the scale bar is 20 μm. EXPRESSION / LABELING:
|
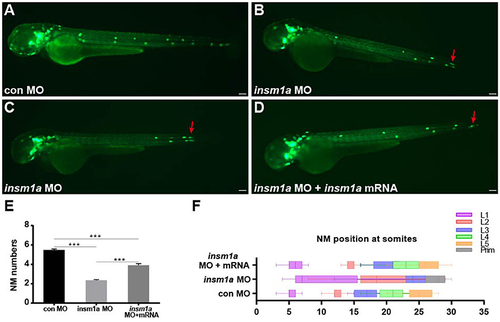
Insm1a is required for proper migration of the pLLp and neuromast deposition. (A–D) Fluorescent images of cldnb:lynGFP embryos at 48 hpf injected with control-MO (A), insm1a-MO (B,C), and insm1a-MO + insm1a mRNA (D). Red arrows indicate the position of the primordium. Scale bars: 100 μm. (E) Quantification of the number of neuromasts (NM) along the body at 48 hpf in control-MO (n = 25), insm1a-MO (n = 121), and insm1a-MO + insm1a mRNA (n = 24). ***p < 0.001. (F) The distribution of deposited neuromasts L1 to L5 in control-MO, insm1a-MO, and insm1a-MO + insm1a mRNA at 48 hpf. PHENOTYPE:
|
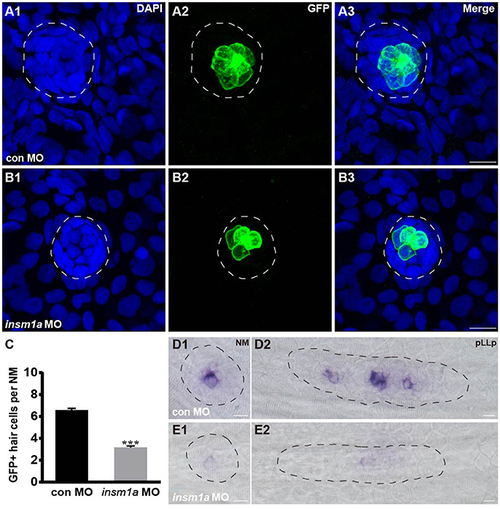
Insm1a regulates hair cell formation in the neuromasts. (A,B) Representative images of the GFP-expressing hair cells in 72 hpf Brn3c:GFP control embryos (A) and insm1a morphants (B). (C) Bar graph of the quantification of the average GFP-positive hair cell numbers per neuromast (NM) for each group. Data are expressed as means ± s.e.m. ***p < 0.001. (D,E) Lateral views of neuromasts and primordia stained by WISH with an atoh1a probe at 30 hpf. The primordium and neuromast are outlined with dotted lines. In all figures, scale bars are 10 μm. PHENOTYPE:
|

Insm1a is required for cell proliferation in the migrating pLLp. (A,B) Representative images of the BrdU immunostaining for proliferating cells in the pLLp in controls (A1–A3) and insm1a morphants (B1–B3) at 32 hpf showing that knocking down of insm1a impairs rosette assembly and cell proliferation. The primordium is outlined with a dotted line. (A3′–B3′) BrdU-positive cells in the rosette at high magnification. White arrows indicate rosettes. Scale bars: 10 μm. (C–E) Quantification of rosette numbers (C), cell numbers (D), and BrdU+ primordium cells (BrdU index) (E) in controls and insm1a morphants. Data are expressed as mean ± s.e.m. ***p < 0.001; **p < 0.01. PHENOTYPE:
|

Insm1a regulates the expression of chemokine signaling components. WISH was used to detect the expression of cxcl12a (A,B), cxcr4b (C,D), and cxcr7b (F,G) in control and insm1a morphants at 30–32 hpf. (E,H) The ratio of cxcr4b-positive cells (E) or cxcr7b-positive cells (H) to total cells in the primordia of controls (black bars) and insm1a morphants (gray bars). Data are expressed as mean ± s.e.m. *p < 0.05; ***p < 0.001. The cxcl12a expression is reduced in insm1a morphants, while cxcr4b expression is up-regulated and cxcr7b expression is down-regulated in insm1a morphants compared to controls. The primordium is outlined with a dotted line, and the anterior is to the left. Scale bar: 50 μm (A,B) and 10 μm (C–F). |
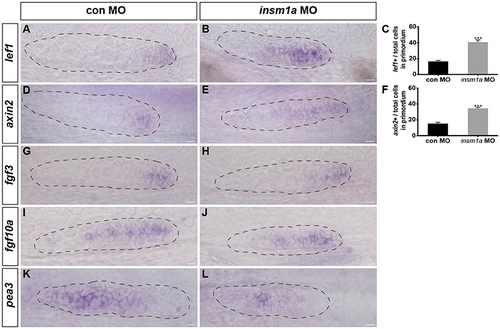
Insm1a regulates the expression of Wnt and Fgf signaling components. Expression of the Wnt and Fgf target genes lef1 (A,B), axin2 (D,E), fgf3 (G,H), fgf10a (I,J), and pea3 (K,L) in control embryos and in insm1a morphants at 30–32 hpf. (C,F) The ratio of lef1-positive cells (C) or axin2-positive cells (F) to total cells in the primordia of controls (black bars) and insm1a morphants (gray bars). Data are expressed as mean ± s.e.m. ***p < 0.001. In insm1a primordia, the expression domains of lef1 and axin2 expand, whereas fgf3 and fgf10a expression is normal but pea3 is reduced. The primordium is outlined with a dotted line, and the anterior is to the left. Scale bar: 10 μm. |
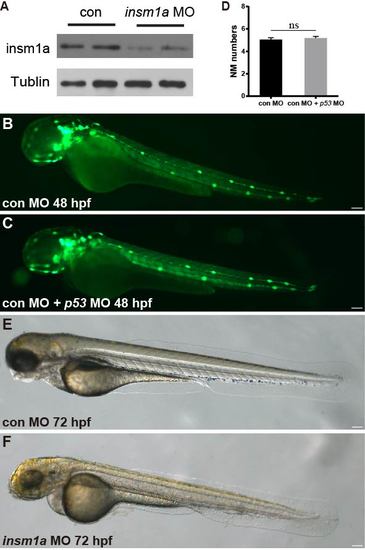
(A) Western blot detection of Insm1a protein in embryos injected with 6 ng insm1a antisense morpholino or 6 ng control morpholino showing a marked reduction of Insm1a protein in the insm1a morphants. The experiment was repeated two times. (B,C) Fluorescent images of cldnb:lynGFP embryos at 48 hpf injected with control-MO (con MO) (B) and con MO + p53 MO (C). Scale bars: 100 μm. (D) Quantification of the number of neuromasts along the body at 48 hpf in con MO (n = 20) and con MO + p53 MO (n = 20). There was no significant difference (p > 0.05). (E,F) Transmitted light images of 72 hpf control morpholino-injected embryo (con MO) (E) or insm1a morphants (insm1a MO) (F). The overall morphology of the insm1a morphants was indistinguishable from controls. Scale bars: 100 μm. |
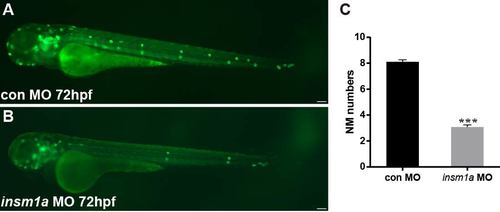
Insm1a knockdown shows a reduction in the number of pLL neuromasts. (A,B) Fluorescent images of cldnb:lynGFP embryos at 72 hpf injected with control-MO and insm1a-MO. Scale bars: 100 μm. (C) Quantification of the number of neuromasts along the body at 72 hpf in control-MO (n = 20) and insm1a-MO (n = 38). ***p < 0.001. PHENOTYPE:
|

Loss of insm1a has no significant effect on cell death. (A,B) TUNEL assay on sections from a control (A) and insm1a morphant (B) at 32 hpf. (C,D) Representative images of cleaved caspase-3 immunohistochemistry in primordia from a control (C) and insm1a morphant (D). No significant difference in the number of apoptotic cells in the insm1a morphant was detected compared to controls. Scale bar: 100 μm (A,B) and 10 μm (C,D). PHENOTYPE:
|