
- Title
-
Embryonic zebrafish primary cell culture for transfection and live cellular and subcellular imaging
- Authors
- Sassen, W.A., Lehne, F., Russo, G., Wargenau, S., Dübel, S., Köster, R.W.
- Source
- Full text @ Dev. Biol.
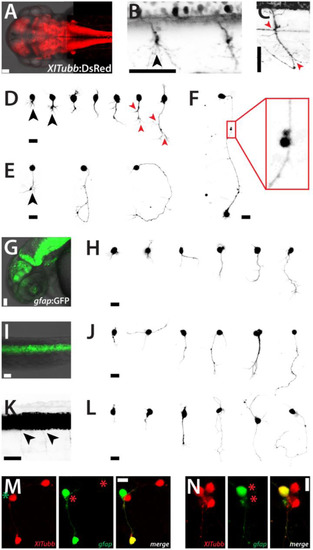
Neurons and glia cells in culture. (A) Head and trunk of a Tg(XITubb:DsRed)zf148 embryo (dorsal view, 2 dpf). Scale bar, 50 µm. (B) Detail of the spinal cord of a Tg(XITubb:DsRed)zf148 embryo (dorsal view, 2 dpf). Motorneurons project highly branched axons (black arrowhead). Scale bar, 50 µm. (C) Detail of the spinal cord of a Tg(XITubb:DsRed)zf148 embryo (lateral view, 2 dpf). A motorneuron with the typical bended axon with several characteristic branching points (red arrowheads) can be observed. Scale bar, 50 µm. Anterior is always to the left. (D,E)XITubb:DsRed-positive neurons in culture displaying representative morphologies at 1 and 2 dap, respectively. Images were sorted by the size of the neurons. Three neurons show highly branched processes like in (B) (black arrowheads). Two neurons strongly resemble the morphology of the motorneuron shown in (C) (red arrowheads). Scale bars, 10 µm. (F) Two XITubb:dsRed-positive neurons at 3 dap forming a putative contact site. Scale bar, 10 µm. (G,I) Head (lateral view) and spinal cord (dorsal view) of a Tg(gfap:GFP)mi2001 embryo (2 dpf). Scale bars, 50 µm. (K) Spinal cord of a Tg(gfap:GFP)mi2001 embryo (lateral view, 2 dpf) displayed at high contrast. Fine cellular protrusions are visible which may represent glia-derived motorneurons still containing stable GFP (black arrowheads). Scale bar, 50 µm. Anterior is always to the left. (H,J,L)gfap:GFP-positive cells in culture displaying representative morphologies at 1, 2 and 3 dap, respectively. Images were sorted by the size of the cells. Scale bars, 10 µm. (M,N) Cultured cells of Tg(XITubb:DsRed)zf148 / Tg(gfap:GFP)mi2001 embryos show overlapping expression of both fluorescent reporters at 2 and 3 dap, respectively. Scale bars, 10 µm. The figure shows a collection of the images of three preparations for Tg(XITubb:DsRed)zf148 and two preparations for Tg(gfap:GFP)mi2001, respectively, with comparable outcomes. |
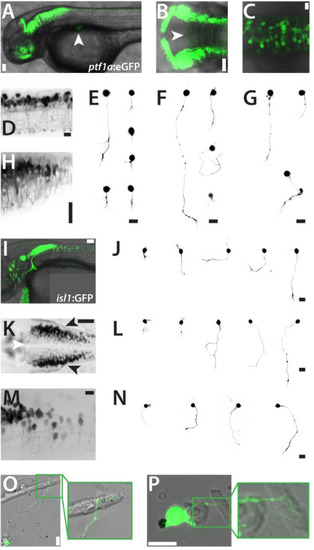
Inhibitory neurons and cranial motoneurons in culture. (A) Tg(ptf1a:eGFP)jh1 embryo (lateral view, 2 dpf). The developing pancreas is marked with a white arrowhead. Scale bar, 50 µm. (B) Hindbrain of a Tg(ptf1a:eGFP)jh1 embryo (dorsal view, 2 dpf) showing eGFP expression in the ventricular zone and long contralateral projections. The white arrowhead indicates the midline. Scale bar, 50 µm. (C,D) Dorsal and lateral details, respectively, of the spinal cord of a Tg(ptf1a:eGFP)jh1 embryo (2 dpf). Scale bars, 50 µm. (H) Lateral detail of the hindbrain/spinal cord transition zone in a Tg(ptf1a:eGFP)jh1 embryo (2 dpf). Scale bar, 150 µm. Anterior is always to the left. (E,F,G)ptf1a:eGFP-positive cells in culture displaying representative morphologies at 1, 2 and 3 dap, respectively. Scale bars, 10 µm. (I) Tg(isl1:GFP)rw0 embryo (lateral view, 2 dpf). Scale bar, 50 µm. (K) Hindbrain of a Tg(isl1:GFP)rw0 embryo (dorsal view, 2 dpf) showing GFP expression cranial motorneurons. The white arrowhead indicates the midline. Scale bar, 50 µm. (M) Lateral detail of the hindbrain/spinal cord transition zone in a Tg(isl1:GFP)rw0 embryo (2 dpf). Scale bar, 50 µm. Anterior is always to the left. (J,L,M)isl1:GFP-positive cells in culture displaying representative morphologies at 1, 2 and 3 dap, respectively. Images were sorted by the size of the cells. Scale bars, 10 µm. (O,P)isl1:GFP positive cells project neurites towards myocytes (2 dap). Scale bars, 10 µm. The figure shows a collection of the images of two preparations for each Tg(ptf1a:eGFP)jh1 and Tg(isl1:GFP)rw0 with comparable results. |
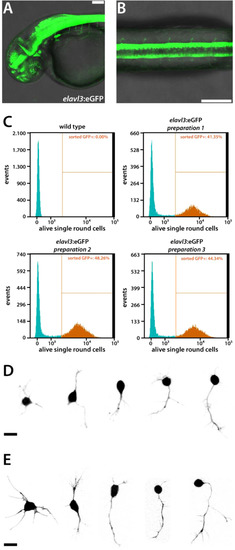
Flow cytometry-sorted neurons show normal morphologies in culture. (A) Tg(elavl3:eGFP)knu3 embryo (lateral view, 2 dpf). Scale bar, 50 µm. (B) Spinal cord of a Tg(elavl3:eGFP)knu3 embryo (dorsal view, 2 dpf). Scale bar, 50 µm. Anterior is always to the left. (C) Dissociated primary cells of 2 dpf wild type (n = 1 preparation) and elavl3:eGFP embryos (n = 3 preparations) gated by the settings described in Fig. S2 were further gated and sorted regarding GFP-expression and plotted as histogram. Virtually no GFP-positive (GFP+) cells were detected in the wild type preparation, meaning that all GFP+ cells of the elavl3:eGFP preparations indeed expressed the transgene. The amount of GFP+ cells was comparable in all three elavl3:eGFP preparations. (D)elavl3:eGFP-positive cells prepared with the standard protocol for primary cell culture (1 dap). Scale bar, 10 µm. (E) Same morphologies as observable in (D) can be found among elavl3:eGFP-positive cells which have been selected by flow cytometry and cultured for 1 day. Scale bar, 10 µm. Shown are collections of the images of (D) two and (E) three preparations with comparable results. |
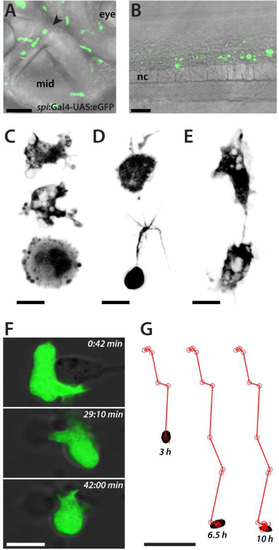
Macrophages in culture. (A) Lateral detail of a Tg(spi1:Gal4-UAS:eGFP)zf109 embryo (2 dpf) showing the distribution and various forms of eGFP-labeled macrophages. The black arrowhead marks the midbrain-hindbrain boundary. mid, midbrain. Scale bar, 50 µm. (B) eGFP-positive macrophages populate the trunk of a zebrafish embryo (lateral view, 2 dpf). sc, spinal cord. Scale bar, 50 µm. Anterior is always to the left. (C) Representative amoeboid morphologies of eGFP-positive macrophages in culture (1 dap). Scale bar, 10 µm. (D) Macrophages with cellular extensions in culture (1 dap). Scale bar, 10 µm. (E) Two macrophages in culture making contact (1 dap). Scale bar, 10 µm. Shown is a collection of the images of two preparations with comparable results. (F) Time series of a single macrophage in culture which apparently tries to engulf cellular debris (3 dap). Scale bar, 10 µm. See also Movie 1. (G) Migration of a single macrophage in culture. Tracking was started approximately 6 h after plating. Images were recorded every 30 min for a duration of 12 h. Scale bar, 50 µm. See also Movie 2. |
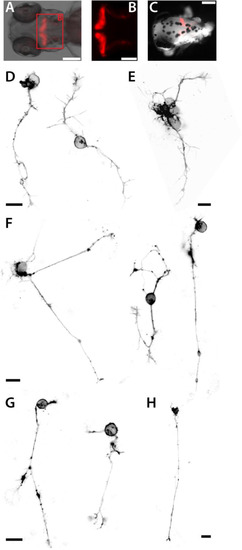
Purkinje cells of 4 dpf embryos in culture. (A) Tg(ca8:FyntagRFP)bz4Tg embryo (dorsal view, 4 dpf). The cerebellum with red fluorescent Purkinje cells shown in (B) is marked by a red box. Scale bar, 100 µm. (C) Decapitated head of a 4 dpf Tg(ca8:FyntagRFP)bz4Tg embryo. Scale bar, 100 µm. (D-H) Red fluorescent Purkinje cells displaying characteristic morphologies at 1 (D,E), 2 (F) and 3 (G,H) dap. Scale bars, 10 µm. The figure shows a collection of the images of two preparations with comparable results. |
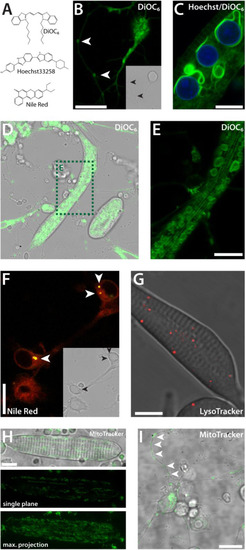
Vital dyes. (A) Chemical structures of commonly used cell-permeant dyes. (B) Neuron-like cell stained with DiOC6 (1 dap). The complete endomembrane system is visible. In a nearby process of a different cell, stained clusters can be observed (white arrowheads). Inset: Corresponding transmitted light image. (C) Striated myocyte co-stained with DiOC6 and Hoechst33258 (1 dap). (D,E) Striated myocyte, stained with DiOC6 (2 dap), (E) is a detail of (D). (F) Neuron-like cells stained with Nile Red (1 dap). Membranes are displayed in red, lipid droplets in yellow (white arrowheads). Inset: Corresponding transmitted light image. (G) Striated myocyte stained with LysoTracker (2 dap). (H) Myocyte stained with MitoTracker (2 dap). (I) Neuron-like cell stained with MitoTracker with distinct mitochondria along processes (2 dap). Scale bars, 10 µm. Each staining method was performed three times or more with several wild type cultures. |
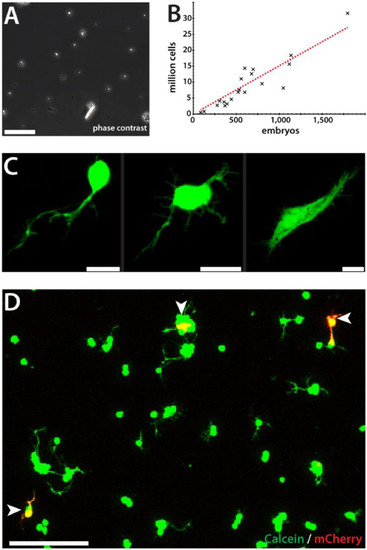
Transfection of zebrafish primary cells by electroporation. (A) Dissociated primary cells. Scale bar, 50 µm. (B) Linear relation between the number of embryos and resulting calculated total cell number. On average, dissociation of 89.3 i.e. 90 embryos will result in 1 million primary cells. n = 20. (C) Electroporation of a pCS-eGFP into wild type primary cells results in fluorescence in apparently differentiated cells in culture (1 dap). Scale bars, 10 µm. (D) Wild type primary cells were electroporated with pCS-mCherry, plated and stained with Calcein-AM at 1 dap to calculate the amount of live transfected cells (white arrowheads). Scale bar, 50 µm. |
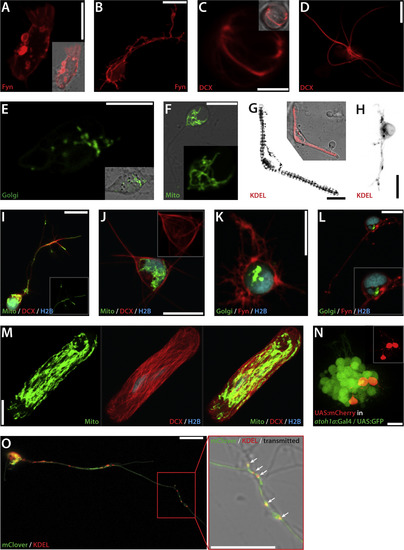
Visualization of subcellular structures in live primary cells. (A) Fibroblast-like cell transfected pCS-Fyn-TagRFP-T (1 dap). Inset: Merged picture of fluorescent and transmitted light channels. (B) Neuron-like cell transfected with pCS-Fyn-TagRFP-T (1 dap). (C) Putative mitotic spindle of a cell transfected with pCS-DCX-tdTomato. Inset: Merged picture of fluorescent and transmitted light channels. (D) Cell with several membrane protrusions highlighted by DCX-tdTomato-labeled microtubules (2 dap). (E) Cell transfected with pCS-Golgi-YFP (3 dap). (F) Neuron-like cell transfected with pCS-MitoTag-YFP (2 dap). Inset: Mitochondria in the cell body in detail. (G) Myocyte transfected with ss-RFP-KDEL (2 dap). The ER is distributed in a “striated” organization. Inset: Merged picture of fluorescent and transmitted light channels. (H) Putative neuron transfected with ss-RFP-KDEL (2 dap). (I) Neuron-like cell triple transfected with pCS-MitoTag-YFP, pCS-DCX-tdtomato and pCS-H2B-mseCFP (2 dap). Inset: Mitochondria in the process. (J) Triple-transfected cell with pCS-MitoTag-YFP, pCS-DCX-tdtomato and pCS-H2B-mseCFP (3 dap). Inset: Microtubular network in the cell body in detail. (K) Triple-transfected cell with pCS-Golgi-YFP, pCS-Fyn-TagRFP-T and pCS-H2B-mseCFP (2 dap). (L) Neuron-like cell triple-transfected with pCS-GolgiTag-YFP, pCS-Fyn-TagRFP-T and pCS-H2B-mseCFP (3 dap). Inset: Cell body in detail. (M) Myocyte triple-transfected with pCS-MitoTag-YFP, pCS-DCX-tdtomato and pCS-H2B-mseCFP (3 dap). Both mitochondria and microtubules form a network in the whole cell. (N) atoh1a-positive neuronal progenitors isolated from Tg(atoh1a:Gal4TA4)hzm2 / Tg(4xUAS:KGFPGI)hzm3 embryos transfected with pSK-UAS:mCherry. Inset: Red fluorescent channel highlighting neuronal processes of individual transfected cells. (O) Putative motorneuron double-transfected with pCS-mClover and ss-RFP-KDEL. The ER is distributed in the axon in a dot-like manner. Scale bars, 10 µm. Each transfection was at least performed two times. The figure shows a collection of images obtained from several preparations. |
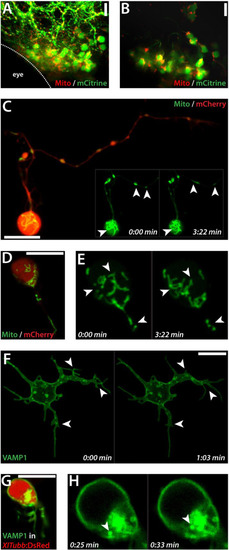
Imaging of subcellular dynamics. (A) Maximal projection of a Z-stack showing cells in the midbrain of a 3 dpf embryo double-transfected with pCS-mCitrine and pCS-MitoTag-RFP. Anterior is to the left. Shown is one embryo out of several successful electroporated embryos from one electroporation approach. (B) Magnified single plane from the Z-stack projection shown in (A), zoomed in. (C) Putative motorneuron in culture co-transfected with pCS-MitoTag-YFP and pCS-mCherry (1 dap). Inset: Two frames of Movie 3 visualizing the dynamics of mitochondria (arrowheads). (D) Neuron-like cell in culture (1 dap) co-transfected with pCS-MitoTag-YFP and pCS-mCherry (1 dap). Mitochondria in the cell body are highly dynamic as shown by two frames of Movie 4 displayed in (E). (F) Cultured cell (1 dap) transfected with pCS-VAMP1-mCitrine. Two frames of Movie 5 are shown. Arrowheads label the dynamic changes of cellular projections. (G) XITubb:DsRed-cell in culture (1 dap) transfected with pCS-VAMP1-mCitrine. (H) Two frames of a time lapse showing the cell body of the cell shown in (G). Arrowheads label the movement of a single vesicle. Scale bars, 10 µm. Each transfection was at least performed three times. The figure shows a collection of images obtained from several preparations. |
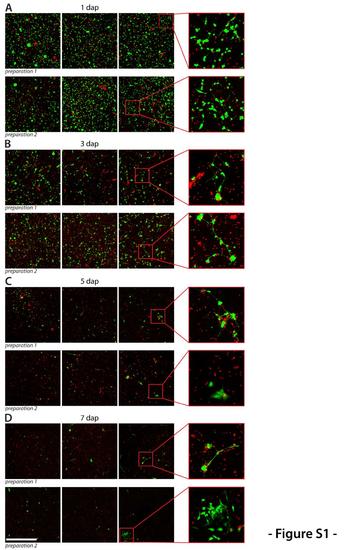
Survival of primary cells. Two cultures were prepared from wild type embryos. Each day, one dish of each culture was co-stained with Calcein-AM to label live cells (green) and propidium iodide which stains all dead cells still attached to the dish (red). Several fields of each dish were imaged to illustrate the amount of viable and dead cells. Shown are representative images of both cultures at (A) 1 dap, (B) 3 dap, (C) 5 dap and (D) 7 dap. Scale bar, 500 μm. |
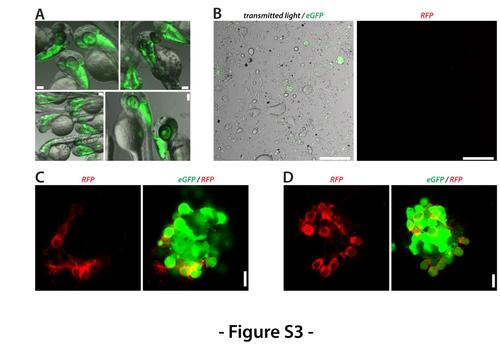
Activation of molecular marker expression after plating. (A) Double transgenic Tg(ptf1a:eGFP) / Tg(ca8:FyntagRFP)bz4Tg embryos show only GFP expression at 2 dpf. Scale bar, 100 μm. (B) No RFP expression could be detected in a primary cell culture obtained from double transgenic Tg(ptf1a:eGFP) / Tg(ca8:FyntagRFP)bz4Tg embryos 60 min after plating. Scale bar, 100 μm. (C) and (D) At 1 dap, few cells were observed in which the expression of the transgene ca8:FyntagRFP was activated. Scale bar, 10 μm. Shown is a collection of the images of two preparations with comparable results. |
Reprinted from Developmental Biology, 430(1), Sassen, W.A., Lehne, F., Russo, G., Wargenau, S., Dübel, S., Köster, R.W., Embryonic zebrafish primary cell culture for transfection and live cellular and subcellular imaging, 18-31, Copyright (2017) with permission from Elsevier. Full text @ Dev. Biol.