
- Title
-
Spontaneous Activity in the Zebrafish Tectum Reorganizes over Development and Is Influenced by Visual Experience
- Authors
- Avitan, L., Pujic, Z., Mölter, J., Van De Poll, M., Sun, B., Teng, H., Amor, R., Scott, E.K., Goodhill, G.J.
- Source
- Full text @ Curr. Biol.
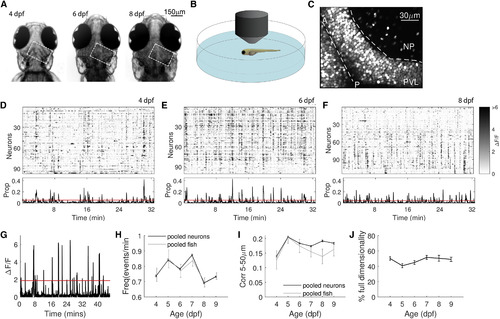
Spontaneous Activity Characteristics Change over Development (A) A developing larval zebrafish head at 4, 6, and 8 dpf. White dashed rectangle is the imaging area. (B) Zebrafish embedded in agarose were imaged in the dark using a two-photon microscope for up to 1 hr (schematic not to scale). (C) Fluorescence image of a 6 dpf tectum expressing H2B-GCaMP6s. PVL, NP, midline (straight dashed line), and anterior (A) and posterior (P) ends of the tectum are indicated. (D–F) Top: raster plots of spontaneous PVL activity at 4 (D), 6 (E), and 8 dpf (F) revealing sporadic single-neuron activity as well as episodes of synchronous activity. Bottom: proportion of co-active neurons as a fraction of the population recorded for each time bin. The red line indicates the threshold derived from a shuffle control for a statistically significant proportion of co-active neurons in a frame (see STAR Methods). (G) A ΔF/F trace of a PVL neuron from a 6 dpf fish. A neuron was considered active if ΔF/F exceeded two SDs above the mean (red line; see STAR Methods). (H) Event frequency increases from 4 to 5–7 dpf and then decreases again at 8 and 9 dpf. Mean event frequencies over neurons (black) and fish (gray) follow a similar profile. Error bars are SEM (4 versus 5 dpf, p = 10−4; 5 versus 6 and 7 dpf, no difference; 5 versus 8 dpf, p = 10−5; 5 versus 9 dpf, p = 10−3;4 versus 8 and 9 dpf, no difference; one-way ANOVA over neurons, Bonferroni correction). (I) Short-range pairwise correlation increases from 4 to 5 dpf. Means over neurons (black) and fish (gray) follow a similar trend (4 versus 5 dpf, p = 10−120; 5 versus 6 dpf, p = 10−14; 5 versus 7 dpf, p = 10−27; 5 versus 8 dpf, p = 10−4; 5 versus 9 dpf, p = 10−10; 4 versus 6 dpf, p = 10−47; 6 versus 7 dpf, no difference; one-way ANOVA over neurons, Bonferroni correction). (J) Data dimensionality as the percentage of principal components required to explain 80% of the variance in activity shows a dip at 5 dpf (4 versus 5 dpf, p = 0.02; 4 dpf versus the rest, no difference; t test). See also Figure S1. |

Neuropil (NP) neurons segregate in two populations, both spatially and functionally. Related to Figure 1. (A) An imaged tectum with an ellipse fitted to the NP area (dashed red line). The antero-posterior (AP, yellow) and latero-medial (LM, red) axes are represented by the two axes of the ellipse. (B) Position of neurons on the LM axis plotted against their event frequency, pooled over fish for each age, shows a significant correlation at 5-8 dpf. (C) Histogram of event frequency of NP neurons (blue) was fitted by a mixture of three Gaussians (red), as determined by the Akaike information criterion (AIC)(inset). This criterion provides a statistically principled way of trading off model complexity against data fit. (D) NP neurons from all ages shown on a common NP ellipse. Color codes each neuron’s event frequency (events/min). (E) Position of all NP neurons on the AP axis plotted against their event frequency shows no significant relationship. (F) Equivalent graph for the LM axis (pooled over all ages) shows a significant correlation. (G) After correction for multiple comparisons there were no significant changes in the frequency of superficial and deep NP neurons over development (one way ANOVA, Bonferroni correction). |