
- Title
-
The tumor suppressor LKB1 regulates starvation-induced autophagy under systemic metabolic stress
- Authors
- Mans, L.A., Querol Cano, L., van Pelt, J., Giardoglou, P., Keune, W.J., Haramis, A.G.
- Source
- Full text @ Sci. Rep.
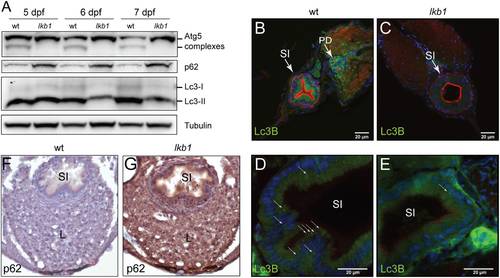
lkb1 mutant larvae show impaired activation of autophagy following yolk depletion. (A) Representative Western blot analysis of Lc3-II, Atg5, p62 and Tubulin (loading control) in total protein lysates of wt and lkb1 trunks between 5–7 dpf. Larvae were treated with chloroquine (2.5 μM) for 14 h prior to processing. The marked decrease in Lc3-II and Atg5-containing complexes together with the p62 accumulation indicate impaired autophagy in lkb1 larvae. Uncropped images of the blots are shown in Supplementary Fig. S7A–C. (B–E) Transverse vibratome sections (150 μm) of intestine of 7 dpf wt and lkb1 mutants stained with anti-LC3B antibody (green), rhodamine-phalloidin to detect F-actin (red) and DAPI to detect nuclei (blue). Lc3B staining in the lkb1 intestine is barely detectable (C,E) and more foci of intense staining were visible in wt sections compared to sections from lkb1 mutants. (F,G) Immunohistochemical analysis of transverse paraffin sections (5 μm) of liver and intestine of 7 dpf wt and lkb1 larvae reveals high levels of p62 accumulation in lkb1 liver and intestine. Magnification: 40×. PD: pronephric ducts; L: liver; SI: intestine. |

ZFIN is incorporating published figure images and captions as part of an ongoing project. Figures from some publications have not yet been curated, or are not available for display because of copyright restrictions. PHENOTYPE:
|
|
ZFIN is incorporating published figure images and captions as part of an ongoing project. Figures from some publications have not yet been curated, or are not available for display because of copyright restrictions. PHENOTYPE:
|
|
ZFIN is incorporating published figure images and captions as part of an ongoing project. Figures from some publications have not yet been curated, or are not available for display because of copyright restrictions. PHENOTYPE:
|
|
ZFIN is incorporating published figure images and captions as part of an ongoing project. Figures from some publications have not yet been curated, or are not available for display because of copyright restrictions. PHENOTYPE:
|
|
ZFIN is incorporating published figure images and captions as part of an ongoing project. Figures from some publications have not yet been curated, or are not available for display because of copyright restrictions. |
|
ZFIN is incorporating published figure images and captions as part of an ongoing project. Figures from some publications have not yet been curated, or are not available for display because of copyright restrictions. PHENOTYPE:
|

Autophagy markers Lc3B and Beclin are lower in lkb1 mutants. (A) The LC3B antibody recognizes the cleaved Lc3-II in zebrafish. Western blot analysis using antibodies against LC3B and beta-actin (loading control) on total protein lysates from human BJEH cells that were serum-starved overnight and wt zebrafish larvae at 11 dpf. The LC3B antibody recognizes the uncleaved and cleaved forms of LC3B in the human sample, but predominantly the cleaved Lc3-II in the zebrafish sample. Uncropped images of the blots are presented in Supplementary Fig. S13. (B) Western blot analysis of Beclin (Becn1) and Histone H3 (loading control) in total protein lysates of wt and lkb1 trunks between 5-7 dpf. Larvae were treated with chloroquine (2.5 μM) for 14 h prior to processing. Becn1 levels are lower in the lkb1 mutants at all time-points. (C-D) Immunohistochemical analysis of transverse paraffin sections (5 μm) of intestine of 7 dpf wt and lkb1 larvae shows very low levels of Becn1 expression in the lkb1 intestine. Magnification: 100X. (E-F) Transverse vibratome sections (150 μm) of liver of 7 dpf wt and lkb1 mutants stained with anti-LC3B antibody (green), rhodamine-phalloidin to detect F-actin (red), and DAPI to detect nuclei (blue). Lc3B staining in the lkb1 liver is greatly reduced. PD: pronephric ducts; L: liver; SI: intestine. |

Rapamycin treatment leads to increased Lc3-II accumulation but does not restore p62 degradation in lkb1 mutants. (A) Western Blot analysis of p62, Lc3-II, and Histone H3 (loading control) in total protein lysates of wt and lkb1 trunks at 6 dpf that were treated with either 10 μM rapamycin from 1 dpf or DMSO (negative control). To detect the autophagic flux the larvae were treated or not with 2.5 μM chloroquine for 14 h prior to processing. Rapamycin treatment leads to increased Lc3-II levels in both wt and lkb1 larvae, but p62 levels remained high in the lkb1 mutants. Uncropped images of the blots are shown in Supplementary Figure S9B. (B) Graphical representation of the data shown in (A), depicting the densitometric p62/H3 and Lc3-II/H3 ratios. (C) Representative image of a wt larva at 6 dpf that has been treated with 10 μM rapamycin from 1 dpf onwards. Note the high amount of yolk still present indicating developmental delay. PHENOTYPE:
|