
- Title
-
Dynamics of actinotrichia regeneration in the adult zebrafish fin
- Authors
- König, D., Page, L., Chassot, B., Jaźwińska, A.
- Source
- Full text @ Dev. Biol.
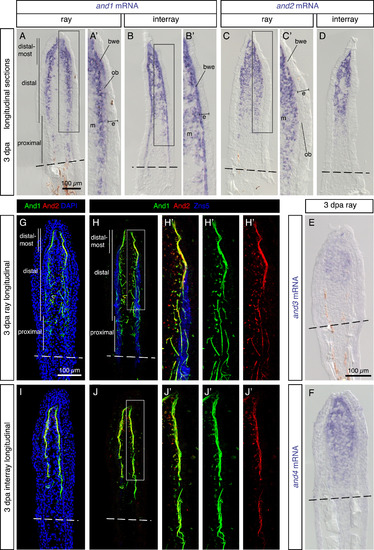
Analysis of the actinotrichia-specific components in the regenerative outgrowth. (A-F) In-situ hybridization with probes against four actinodin genes on longitudinal fin sections at 3 dpa. N ≥ 4 fins; ≥ 3 sections per fin. (A, B) and1 mRNA is detected in the mesenchyme (m) of the blastema and in the basal wound epithelium (bwe). No expression is detected in the basal wound epithelium adjacent to osteoblasts (ob) in the ray. (C, D) and2 (E) and3 (F) and4 genes are co-expressed in the mesenchyme of the blastema, but not in the epidermis (e). (G-J) Immunofluorescence staining of longitudinal fin sections of ray (G, H) and interray (I, J) at 3 dpa. And1 (green) and And2 (red) proteins are co-localized in actinotrichia fibers. Rays and interrays are identified by the presence versus absence of Zns5-positive osteoblasts (H, J, blue). Actinotrichia fibers are predominantly found in the subepithelial position with the exception of osteoblast-containing regions. N = 4 fins; 3 sections per fin. Higher magnifications of framed areas are labeled with the same letter with a prime symbol. Fin amputation planes are shown with a dashed line. The same rules apply to all subsequent figures. EXPRESSION / LABELING:
|
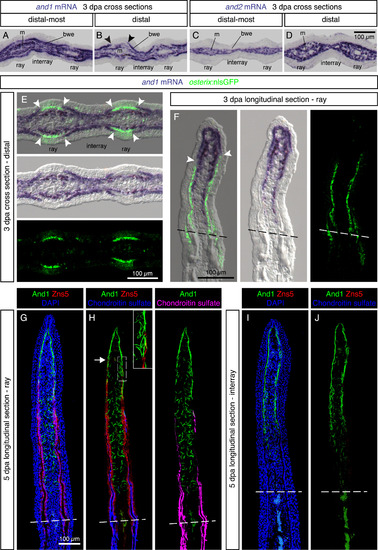
Regenerating lepidotrichia replace actinotrichia in the subepidermal space. (A-D) In-situ hybridization on cross sections of distal-most and distal fin outgrowth at 3 dpa. N = 4 fins. (A, B) In the distal blastema, and1 is differentially expressed in the basal wound epithelium of the rays and interrays. Arrowheads indicate the positions of the interrupted and1 expression in the basal epithelium. m, mesenchyme; bwe, basal wound epithelium. (C, D) and2 is absent from the wound epidermis. (E, F) In-situ hybridization against and1 on transversal (E) and longitudinal sections (F) of osterix:nlsGFP transgenic fins. A lack of and1 expression in the basal wound epithelium of rays is associated with the presence of underlying osteoblasts (green). Arrowheads indicate the positions of the interrupted and1 expression in the basal epithelium. N = 6 fins, 2 sections per fin. (G-J) Immunofluorescence staining for And1 (green), Zns5 (red) and Chondroitin sulfate (H, J, blue) at 5 dpa. (G, H) In the ray, the leading edge of osteoblasts (arrow) replaces actinotrichia in the subepidermal compartment. In the mesenchyme, actinotrichia are disrupted and misaligned. (I, J) In the interrays, no Zns5 and chondroitin sulfate is detected. Actinotrichia remain longitudinally organized in the junctional region between the epidermis and the mesenchyme. The green signal at the base of the outgrowth corresponds to blood autofluorescence. N = 4 fins; 2 sections per fin. EXPRESSION / LABELING:
|
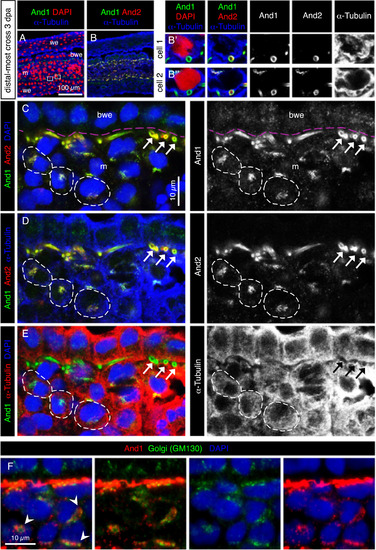
The subcellular distribution of And1 and And2 suggests their vesicular transport in mesenchymal cells. (A-F) Immunofluorescence staining of transversal sections of the distal-most outgrowth at 3 dpa (A-E) Quadruple staining for And1, And2, the cytoplasmic marker α-Tubulin and nuclear DAPI. (A, B) Overview of the tissue and magnification of two cells in the blastema. And1/2 antibodies detect ring-like structures, which are cross-sections of actinotrichia fibers. Actinotrichia are partially engulfed by mesenchymal cells, but remain extracellular. (C-E) The same specimen of the distal-most outgrowth presented in a different combination of stainings and colors. Pink dashed lines indicate the position of the basement membrane. And1 and And2 colocalize at the circumference of actinotrichia fibers (white arrows). Dotted distribution of both proteins in the α-Tubulin-labeled cytoplasm (dashed outline) indicates a subcellular localization in the vesicular system. And1 is detected in the basal wound epithelium and mesenchyme, while And2 is detected only in the mesenchyme. N = 4 fins. (F) Immunofluorescence for Golgi matrix protein GM130 (green) and And1 (red), showing colocalization of both markers in a form of perinuclear aggregates. m: mesenchyme, we: wound epidermis, bwe: basal wound epithelium. N = 4 fins. EXPRESSION / LABELING:
|
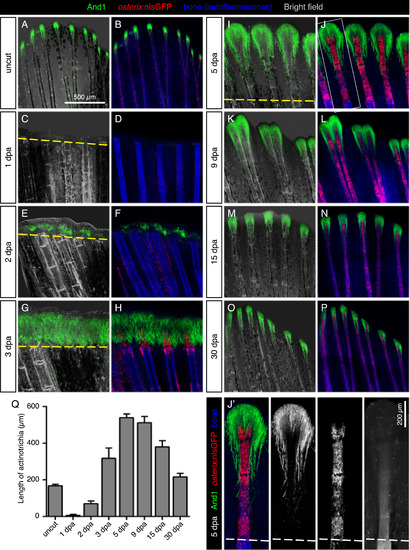
Dynamics of actinotrichia regeneration correlate with lepidotrichia regrowth. (A-P) Immunofluorescence staining for And1 (green) in osterix:nlsGFP fish (osteoblasts; red) at different time points after amputation (dpa). Bone matrix/tissue autofluorescence shown in blue. (Q) Quantification of the length of And1 EXPRESSION / LABELING:
|
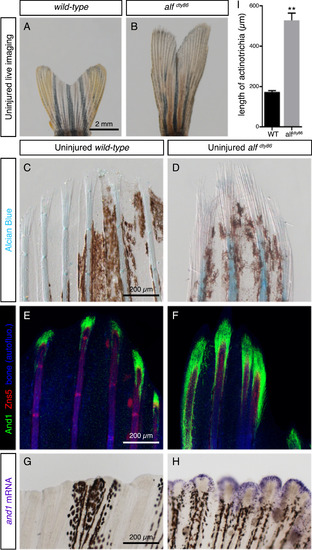
Elongated uninjured fins of alfdty86 mutant fish contain extended actinotrichia. (A, B) Live-imaging of adult caudal fins in wild-type fish and alfdty86 mutants. (C, D) Alcian blue histological staining of uninjured caudal fins shows uncalcified lepidotrichia/cartilage (blue). Bundles of actinotrichia are unstained, but visible by a differential contrast at the tips of rays. Brown patches correspond to endogenous fin pigmentation. N = 4 fins. (E, F) Double immunostaining of wild-type and alfdty86 mutant fins using And1 (green) and osteoblast marker Zns5 (red) antibodies. Tissue autofluorescence shown in blue. N = 4 fins. (G, H) In-situ hybridization with and1 probe on whole-mount fins labels uninjured fin margin of alfdty86 mutant fins, but not wild-type ones. N = 5 fins. (I) Quantification of length of actinotrichia in wild-type versus alfdty86 uninjured fins based on And1 staining (6 rays quantified for each fin, N = 4 fish per group. Error bars indicate SEM, ** P<0.01). |
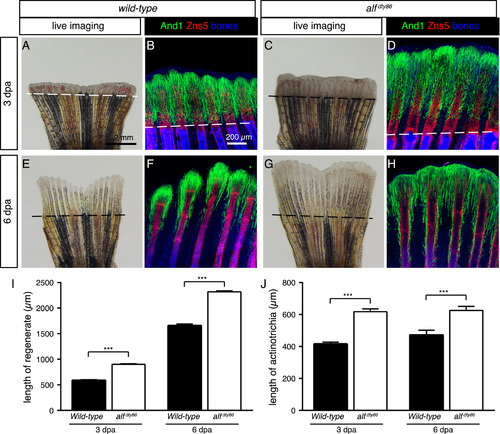
Accelerated fin regeneration in alfdty86 mutant fish is accompanied by elongated actinotrichia. (A, C, E, G) Live-imaging of wild-type and alfdty86 mutant fins at 3 and 6 dpa. The regenerative outgrowth is more advanced in alfdty86 mutant fins as compared to control. (B, D, F, H) Whole-mount immunofluorescence staining against And1 (green) and Zns5 (red). Bone/tissue autofluorescence shown in blue. And1-positive tissue is elongated in the regenerative outgrowth of alfdty86 mutant fins. N ≥ 4 fish per group. (I, J) Quantification of the outgrowth and actinotrichia length at 3 and 6 dpa. (N ≥ 4 fins for each time point. 6 rays per fin. Error bar indicates SEM, *** P<0.001). PHENOTYPE:
|
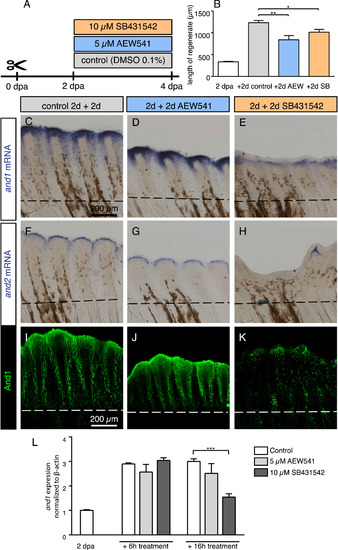
Modulation of and1 and and2 expression in response to pulse inhibition of TGFβ/Activin-βA and IGF signaling. (A) Experimental design for inhibition of TGFβ/Activin-βA signaling by SB431542 and of IGF signaling by AEW541. (B) Quantification of length of regenerate as the average length of the second, third, and fourth rays from the lateral edge of the fin. N ≥ 4 for each group. Error bar indicates SEM, *P<0.05, ** P<0.01. (C-H) Whole-mount in-situ hybridization for and1 and and2 on 4 dpa fins. Inhibition of TGFβ/Activin-βA (SB431542) blocked expression of both genes, whereas inhibition of IGF (AEW541) had no effect. (I-K) Whole-mount immunofluorescence staining for And1 (green) on 4 dpa fins. TGFβ/Activin-βA inhibition (K) caused a loss of actinotrichia as compared to control (I) and IGF inhibition (J). (L) qRT-PCR analysis of and1 expression after 6 h or 16 h of treatment with the pharmacological inhibitors AEW541 (IGF pathway) and SB431542 (TGFβ/Activin-βA pathway). Treatments started at 2 dpa. The relative expression was normalized to control fins at 2 dpa. N = 3 (9 fins each). Error bars represent SEM, *** P<0.001. |
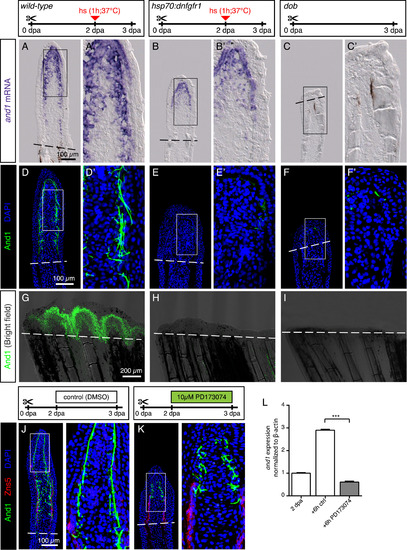
FGF signaling is essential for actinotrichia formation and maintenance. (A-C) In-situ hybridization for and1 on 3 dpa sections in control, hsp70:dnfgfr1-egfp and dob fish. Control and dnfgfr1 fish underwent heat shock (hs) at 2 dpa. N = 4 fins per group. (D-F) Immunofluorescence for And1 (green) on longitudinal sections at 3 dpa in control, hsp70:dnfgfr1-egfp, and dob fish. N = 4 fins per group. (G-I) Whole-mount immunofluorescence staining for And1 (green) overlaid with bright field images for all experimental groups. N = 3 fins per group. Both, transgenic expression of dnfgfr1 and dob mutation cause a drastic decrease in and1 expression (B-C) and And1 deposition (E-F, H-I). (J, K) Immunofluorescence staining with And1 (green) and Zns5 (red) on 3 dpa longitudinal sections of fins of control fish and fish treated with PD173074 for 1 day. One day of treatment with the inhibitor of FGF signaling starting at 2 dpa is sufficient to disrupt actinotrichia in the blastema. N = 4 fins. (L) qRT-PCR analysis of and1 expression after 6 h of treatment with 10 μM of the pharmacological inhibitor of the FGF pathway, PD173074. Treatment started at 2 dpa. The relative expression was normalized to control fins at 2 dpa. N = 3 (9 fins each). Error bars represent SEM. *** P<0.001. |
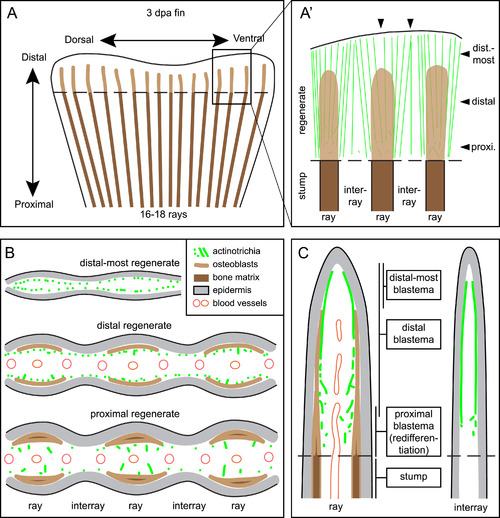
Schematic representation of actinotrichia localization in fins at 3 dpa. (A) Regenerating stump of a caudal zebrafish fin at 3 days post amputation (dashed line). Lepidotrichia of the stump contain bone matrix (dark brown lines), whereas regenerating bones in the outgrowth consists of activated osteoblasts (light brown) with no or little bone matrix at this time point. Actinotrichia fibers (green) are oriented longitudinally to the proximo-distal axis in the new tissue (B) Transversal (cross) sections at different proximo-distal levels of the regenerate. (C) Longitudinal sections through ray and interray tissue. Actinotrichia are located between epidermis and mesenchyme in the distal-most blastema of the rays and in the entire distal blastema of the interrays. In the presence of regenerating bones in the rays, actinotrichia are displaced from their subepidermal position into the mesenchymal compartment where they become disrupted and misaligned in the proximal part of the regenerates. |
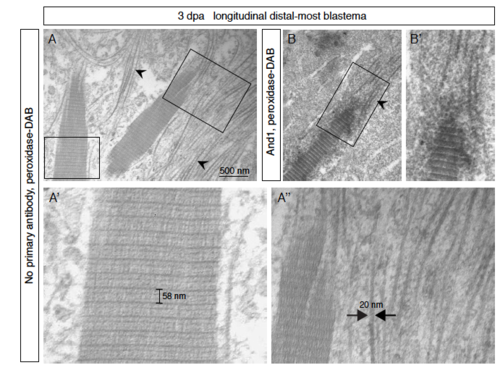
Assembly of actinotrichia detected by electron microscopy of the distal-most blastema. (A-B) Electron microscopy of the distal-most blastema at 3 dpa was performed after peroxidase- DAB immunohistochemical staining following no primary antibody (control; A) or in combination with And1 antibody (darker immunolabeled actinotrichia; B). Thin fibrils of a constant width of ≈ 20 nm (arrowheads; A’’) assemble into higher order striated fibers (A’). (A’) The main periodic striation of ≈ 60 nm is further subdivided into finer bands. (A’’) An accretion of fibrils on the extremities and surface of the actinotrichia are observed, so that the units may grow in width and in length. |
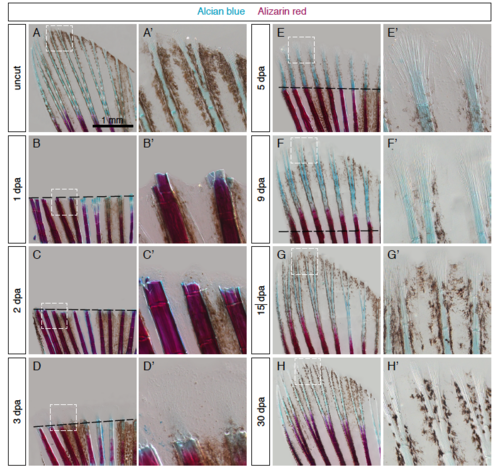
Dynamics of bone matrix formation during regeneration. (A-H’) Dynamics of bone matrix formation during fin regeneration visualized by Alcian blue and Alizarin red histological staining. Calcified lepidotrichia/bone in pink, non-calcified lepidotrichia in blue. Actinotrichia seen in contrast in the magnified panels. Black dashed lines represent plane of amputation. N ≥ 4 fins for each time point. |
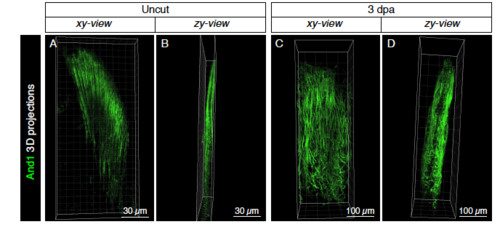
Actinotrichia fibers form palisades on both sides of the distal blastemal mesenchyme. (A-D) 3D projections of actinotrichia (And1; green) in uninjured (A, B) and at 3 dpa (C, D) fins. Images extracted from S1 Movie. Side views (B, D) show that actinotrichia fibers form two-sided palisades. |
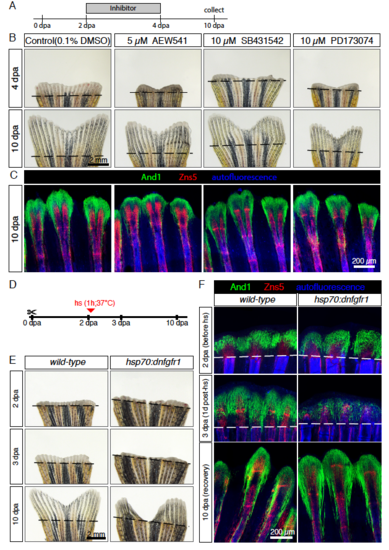
Actinotrichia resume regeneration after a pulse inhibition of signaling pathways. (A-C) Pulse exposure to the inhibitors of the IGF (AEW541), TGFβ/Activin-βA (SB431542) and FGF (PD173074) signaling pathways. (A) Experimental design. (B) Live-imaging at 4 and 10 dpa. Fins resumed regeneration without major morphological defects after interruption of treatments. N = 4 fish per treatment. (C) Whole-mount immunofluorescent staining for And1 (green) and Zns5 (red) of 10 dpa fins shows recovery of actinotrichia fibers after arrest of treatment. Bone autofluorescence in blue. N = 4 fish per treatment. (D-F) Pulse inhibition of the FGF pathway through heat-shock activation of the dominant negative FGF receptor type 1 (hsp70:dnfgfr1-egfp fish). (D) Experimental design (E) Live-imaging at 2, 3 and 10 dpa shows recovery after pulse inhibition of the FGF pathway. Persistent morphological defects in 2 of 4 transgenic fins. (F) Whole-mount immunofluorescent staining for And1 (green) and Zns5 (red) of 2, 3 and 10 dpa fins. Bone autofluorescence in blue. After heat-shock actinotrichia fibers decreased in the blastema (3 dpa). At 10 dpa, actinotrichia recovered. N ≥ 3 fish per group per time point. hs: heat shock. |
Reprinted from Developmental Biology, 433(2), König, D., Page, L., Chassot, B., Jaźwińska, A., Dynamics of actinotrichia regeneration in the adult zebrafish fin, 416-432, Copyright (2017) with permission from Elsevier. Full text @ Dev. Biol.