
- Title
-
Wnt signalling controls the response to mechanical loading during Zebrafish joint development
- Authors
- Brunt, L.H., Begg, K., Kague, E., Cross, S., Hammond, C.L.
- Source
- Full text @ Development

Patterns of biomechanical strain and the location of Wnt-responsive cells at the zebrafish lower jaw between 3 and 5 dpf. (A,A′) Finite element (FE) model of maximum (E max. P., tension, A) and minimum (E min. P., compression, A′) principal strain on the zebrafish lower jaw during mouth opening at 5 dpf. (B,B′) FE model of maximum (E max. P., tension, B) and minimum (E min. P., compression, B′) principal strain on the jaw joint during mouth closure at 5 dpf. Colour key represents strain in microstrain (µstrain units). (A″,B″,C-E) Tg(7xTCF.XlaSiam:nlsGFP) and Tg(Col2a1aBAC:mcherry) transgenic zebrafish lines with, respectively, the Wnt-responsive cells (green) and cartilage (red) of the lower jaw labelled at 3 (C), 4 (D) and 5 dpf (A″,B″,E). (C-E) Left: lower jaw. Right and B″: jaw joint. (A,A′,B,B′) Reproduced fromBrunt et al. (2015), where it was published under a CC-BY license (https://creativecommons.org/licenses/by/4.0/). A, anterior; P, posterior; M, medial; L, lateral; MC, Meckel's cartilage; JJ, jaw joint; PQ, palatoquadrate; C, cartilage; lg, ligament; *anterior MC; **jaw joint. Scale bars: 40 μm in A″; 10 μm in B″; 20 μm in C-E. EXPRESSION / LABELING:
|

Immobilisation causes a reduction in canonical Wnt signalling activity at the zebrafish lower jaw. (A,B) Tg(7xTCF.XlaSiam:nlsGFP) and Tg(Col2a1aBAC:mcherry) transgenic zebrafish lines were used to visualise Wnt-responsive cells (green) and chondrocytes (red) in 5 dpf control (A) and 5 dpf immobilised (B) zebrafish. Anaes, anaesthetised larvae from 3 to 5 dpf. Left: merge of Tg(7xTCF.XlaSiam:nlsGFP) and Tg(Col2a1aBAC:mcherry). Right: segmentation of GFP signal. Black arrows indicate cells surrounding the jaw joint; red arrows indicate ligaments and tendons. (C) Left: volume analysis of Tg(7xTCF.XlaSiam:nlsGFP) GFP+ signal at the region of interest (ROI) from six intercalating cells above the Meckel's cartilage (MC) jaw joint (JJ) and along the full extent of the palatoquadrate (PQ) (white line). Right: segmentation of GFP+ signal volume from the ROI in 5 dpf control and anaesthetised zebrafish. (C′) Volume (µm3) of GFP+ signal at the MC joint and along the PQ in 4 and 5 dpf control and anaesthetised zebrafish (n=8, 10, 27 and 13 joints). (D) Left: volume analysis of Tg(7xTCF.XlaSiam:nlsGFP) GFP+ signal at the ROI from six intercalating cells above the MC jaw joint to the interzone (white line). Right: segmentation of GFP+ signal volume from the ROI in 5 dpf control and anaesthetised zebrafish. (D′) Volume (µm3) of GFP+ signal at the MC joint in 4 and 5 dpf control and anaesthetised zebrafish (n=16, 14, 30 and 18 joints). (E) Tg(7xTCF.XlaSiam:nlsGFP) and Tg(Col2a1aBAC:mcherry) transgenic zebrafish with Wnt-responsive cells and cartilage of the lower jaw at the jaw joint labelled in 4 and 5 dpf control and anaesthetised zebrafish. White arrowheads indicate joint-associated GFP+ cells. White arrows indicate ligament and tendon GFP+ cells. (F) Number of GFP+ cells in 4 and 5 dpf control and anaesthetised zebrafish in a 50×80 µm area surrounding the jaw joint (n=15, 18, 31 and 13 joints). (G) Number of ligament and tendon GFP+ cells in 4 and 5 dpf control and anaesthetised zebrafish at the jaw joint. (n=15, 18, 31 and 13 joints). Kruskal–Wallis tests were carried out for statistical analysis in C′,D′,G and one-way ANOVA in F. ns, not significant, *P≤0.05, ***P≤0.001. Data are mean and 95% confidence interval. |

Manipulation of Wnt affects zebrafish jaw joint morphology. (A,A′) 5 dpf DMSO control (A) and 5 dpf 20 µM IWR-1-treated (from 3-5 dpf) (A′) zebrafish jaw joint morphology. Left: Tg(Col2a1aBAC:mcherry) transgenic zebrafish line marks the cartilage of the jaw joint. Middle: 3D volume rendering of jaw joint. Right: outlines of four representative jaw joints. A, anterior; P, posterior; M, medial; L, lateral. White lines indicate interzone interval measurements between MC and PQ; yellow line indicates overlapping interval between MC and PQ. (B,B′) Interzone intervals (µm) between the MC and PQ on the medial (B) and lateral (B′) regions of the jaw joint in 5 dpf DMSO and IWR-1-treated zebrafish. Negative values represent an overlap of MC/PQ elements (n=42 and 45 joints). Two-tailed Student's t-tests were performed for B,B′. (C,C′) 5 dpf control-injected (C) and Wnt16 morpholino (MO)-injected (C′) zebrafish jaw joint morphology. Left: immunohistochemical stain of the jaw joint region. Middle: 3D volume rendering of the jaw joint. Right: outlines of four representative jaw joints. (D,D′) Interzone intervals (µm) between the MC and PQ on the medial (D) and lateral (D′) regions of the jaw joint in 5 dpf control-injected and Wnt16 MO-injected zebrafish. Negative values represent an overlap of MC/PQ elements (n=8, 11, 6 and 8 joints). One-way ANOVA calculations were performed (D,D′). ns, not significant, *P≤0.05, ***P≤0.001. Data are mean and 95% confidence interval. (E) 3D volume rendering of 5 dpf injected CRISPR/Cas9 mosaic wnt16 knockout Tg(Col2a1aBAC:mcherry) larvae (1,2) (n=12 animals). Image was enlarged and rotated to best show the jaw joint (1′,2′). Right: outlines of four representative jaw joints. |

Immobilisation and Wnt16 knockdown affects cell proliferation and migration at the medial region of the jaw joint between 3 and 5 dpf. (A-D′) Tg(Sox10:GAL4-VP16) and Tg(UAS:Kaede) transgenic line drives expression of Kaede protein (green) in the cartilage of control (A), anaesthetised (B), control-injected (C) and Wnt16 morpholino (MO)-injected (D) zebrafish. Maximum projections of the jaw joint from stacks of tiff images (A,B,C,D) and single slice/substacks through the same jaw joint to show cell morphology (A′,B′,C′,D′) are represented. At the jaw joint, medially located Kaede-expressing cells are photoconverted to red Kaede at 3 dpf (left panels). Right panels show jaw joints from the same larva re-imaged at 5 dpf. Photoconverted cells appear red/orange owing to presence of photoconverted red Kaede and expression of newly made green Kaede protein under control of the sox10 promoter. (E) Percentage increase in total area of cells expressing photoconverted red Kaede between 3 and 5 dpf in control, anaesthetised, control-injected and Wnt16 MO-injected zebrafish jaw joints (n=17, 18, 10 and 8 joints, respectively). (F) Percentage increase in number of cells expressing photoconverted red Kaede between 3 and 5 dpf in control, anaesthetised, control-injected and Wnt16 MO-injected zebrafish jaw joints (n=17, 16, 10 and 10 joints, respectively). Kruskal–Wallis tests were performed for E,F. ns, not significant, *P≤0.05, ***P≤0.001. Data are mean and 95%CI. EXPRESSION / LABELING:
PHENOTYPE:
|
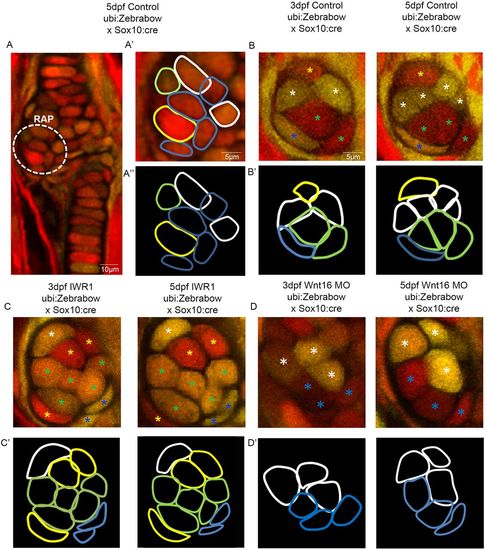
Wnt manipulation affects cell proliferation and cell morphology at the jaw joint, revealed using the Zebrabow transgenic line. (A-A″): Tg(ubi:Zebrabow) and Tg(Sox10:cre) transgenic lines generate multiple colours of fluorescence in zebrafish cartilage, including at the region of interest at the retroarticular process (RAP) (white dotted line). Cell outlines were created at the RAP: (A′) RAP cell outlines overlaid with confocal image; (A″) cell outlines. (B,C,D) 3 and 5 dpf Tg(ubi:Zebrabow) and Tg(Sox10:cre) control (B), IWR-1-treated (C) and Wnt16 MO-injected zebrafish (D) (n=10, 11 and 20 joints). The RAP of the MC jaw joint is shown. Asterisks of different colours mark cells at 3 and 5 dpf (indicating re-identification and cell division events). (B′,C′,D′) Outlines of individual cells in the RAP of the MC jaw joint, identified in control (B′), IWR-1-treated (C′) and Wnt16 MO-injected (D′) Tg(ubi:Zebrabow) and Tg(Sox10:cre) transgenic zebrafish. Outline colour of individual cells in B′,C′,D′ matches the asterisk colours in B,C,D. PHENOTYPE:
|

Identification of a heterogenous population of Wnt responsive cells at the lower jaw. (A): Tg(7xTCF.XlaSiam:nlsGFP) (Wnt:GFP) and Tg(Col2a1aBAC:mcherry) (Col2) transgenic zebrafish lines mark Wnt responsive cells and cartilage of the jaw joint elements at 4dpf in a single z-slice. Brackets identify Wnt responsive chondrocytes. (B): Antibodies against GFP and Tenascin C were used to detect colocalisation of Tg(7xTCF.XlaSiam:nlsGFP) Wnt responsive cells and ligaments and tendons at 5dpf, (left panel). Right panel: zoomed image from white box. JJ= jaw joint, A= anterior, P= posterior, M= medial, L= lateral. |

Wnt16 morpholino (MO) knockdown validation. (A): PCR of Wnt16 cDNA amplified from 1ng total RNA extracted from 3dpf control or Wnt16 morphant larvae using primers described in (Clements et al.,2011). (B): Brightfield image of gross morphology of 5dpf control and Wnt16 MO injected zebrafish. |

Wnt16 morpholino knockdown affects canonical Wnt activation in the jaw. (A,A’): in situ hybridisation of lef1 mRNA expression in 3dpf control injected (A) and Wnt16 MO injected (A’) zebrafish. (n=9, 19 animals). Left panels: lateral view of head. Middle panels: Ventral view of head. Right panels: Ventral view of branchial arches. B= brain, br=branchial arches. (B): Left panel: volume analysis of Tg(7xTCF.XlaSiam:nlsGFP) GFP-positive (GFP+) signal at the region of interest (ROI) from the Meckel’s Cartilage (MC) jaw joint (JJ) and along the full extent of the palatoquadrate (PQ) (white line). Right panel: Segmentation of GFP+ signal volume from region of interest in 3dpf control injected and Wnt16 morphant zebrafish. (C): Left panel: volume analysis of Tg(7xTCF.XlaSiam:nlsGFP) GFP-positive (GFP+) signal at the ROI from the Meckel’s Cartilage (MC) jaw joint to the interzone (white line). Right panel: Segmentation of GFP+ signal volume from region of interest in 3dpf control injected and Wnt16 morphant zebrafish. (D): Volume (μm3) of GFP+ signal at the MC joint and along the PQ (as measured in (B)) in 3dpf control injected and Wnt16 MO injected zebrafish. (n=8, 8 joints). (E): Volume (μm3) of GFP+ signal at the MC joint (as measured in (C)) in 3dpf control injected and Wnt16 MO injected zebrafish. (n=8, 8 joints). Two-tailed student t- tests were performed for (D,E). ***=p≤0.001. Bars on graph represent mean and 95%CI. |

BrdU staining reveals cells proliferation at the jaw joint is affected by Wnt16 morpholino knockdown. (A-A''): Cell proliferation at the jaw joint occurs frequently between 4-5dpf. Pulse-chase experiments exposing control zebrafish to BrdU between 3-4dpf (A), 4-5dpf (A’) and 3-5dpf (A''). (A-A'') include max projection of image and substack through the cartilage joint. Anti-BrdU (green) and anti- collagen-II (red) label proliferating cells and cartilage at the jaw joints, respectively. (B-C): Pulse- chase experiments exposing control (B,B’) and Wnt16 MO injected (C,C') zebrafish to BrdU between 4-5dpf. Anti-BrdU (green) and anti-collagen-II (red) label proliferating cells and cartilage, respectively, at the jaw joint (left panel) and intercalating MC element region (right panel). (D): Number of BrdU positively labelled cells (BrdU +ve) at the jaw joint of 5dpf control injected and Wnt16 MO injected zebrafish after exposure to BrdU between 4-5dpf. (n=20, 13 joints). (E): Number of BrdU positively labelled cells (BrdU +ve) in the mid MC element intercalating region of 5dpf control injected and Wnt16 MO injected zebrafish after exposure to BrdU between 4-5dpf. (n=20, 11 joints). A Mann-Whitney U test was performed for (D) and a two-tailed student t-test for (E). ns= not significant, *=p≤0.05, **=p≤0.01, ***=p≤0.001. Bars on graph represent mean and 95%CI. |

Mosaic CRISPR knockout of Wnt16 affects cell migration at the medial region of the jaw joint. (A-B'): Tg(Sox10:GAL4-VP16) and Tg(UAS:Kaede) transgenic line drives expression of kaede protein (green) in cartilage of control injected (A), and mosaic CRISPR Wnt16 knockout (B) zebrafish. Maximum projections of the jaw joint from stacks of tiff images (A,B) and single slice/substacks through the same jaw joint to show cell morphology (A',B') are represented. At the jaw joint, medially located kaede expressing cells are photoconverted to red kaede at 3dpf (left panels). Right panels show jaw joints from the same larva reimaged at 5dpf. Photoconverted cells appear red/orange due to presence of photoconverted red kaede and expression of newly made green kaede protein under control of sox10 promoter. (C): Percentage increase in total area of cells expressing photoconverted red kaede between 3 and 5dpf in control injected (Fig. 4E) and CRISPR Wnt16 knockout zebrafish jaw joints. (n=10, 22 joints). Kruskal-Wallis tests were performed for (C). ***=p≤0.001. Bars on graph represent mean and 95%CI. |
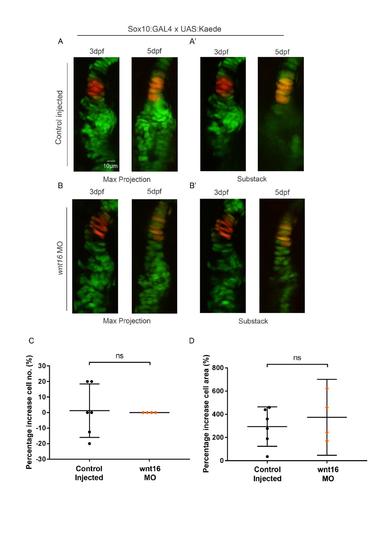
Cell proliferation and migration in intercalating cells of the Meckel’s cartilage are not affected by Wnt16 morpholino knockdown. (A-B'): Tg(Sox10:GAL4-VP16) and Tg(UAS:Kaede) transgenic line drives expression of kaede protein (green) in cartilage of control injected (A) and Wnt16 MO injected (B) zebrafish. Maximum projections of the jaw joint from stacks of tiff images (A,B) and single slice/substacks through the same jaw joint to show cell morphology (A',B') are represented. Kaede expressing cells located in the mid region of the MC are photoconverted to red kaede at 3dpf (left panels). MC of the same fish is then reimaged at 5dpf (right panels). Photoconverted cells appear red/orange due to presence of photoconverted red kaede and new expression of green kaede protein. (C): Percentage increase in number of cells expressing photoconverted red kaede between 3 and 5dpf in control injected and Wnt16 MO injected zebrafish MC elements. (n=6, 4 animals). (D): Percentage increase in total area of cells expressing photoconverted red kaede between 3 and 5dpf in control injected and Wnt16 MO injected zebrafish. (n=6, 4 animals). Two-tailed student t-tests were performed (B,C). ns= not significant. Bars on graph represent mean and 95%CI. |