
- Title
-
MPI depletion enhances O-GlcNAcylation of p53 and suppresses the Warburg effect
- Authors
- DeRossi, C., Shtraizent, N., Nayar, S., Sachidanandam, R., Katz, L.S., Prince, A., Koh, A.P., Vincek, A., Hadas, Y., Hoshida, Y., Scott, D.K., Eliyahu, E., Freeze, H.H., Sadler, K.C., Chu, J.
- Source
- Full text @ Elife

ZFIN is incorporating published figure images and captions as part of an ongoing project. Figures from some publications have not yet been curated, or are not available for display because of copyright restrictions. |
|
ZFIN is incorporating published figure images and captions as part of an ongoing project. Figures from some publications have not yet been curated, or are not available for display because of copyright restrictions. |
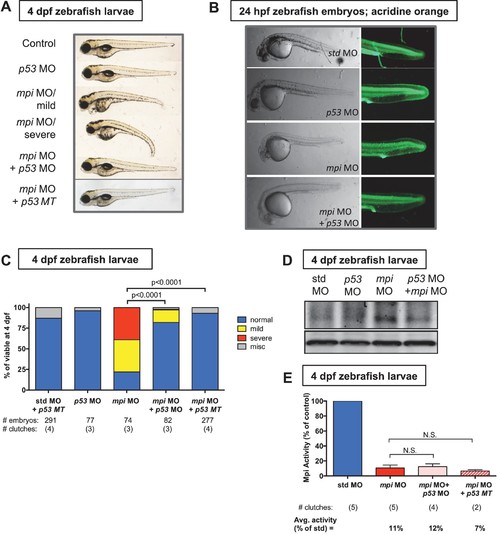
p53 is downstream of Mpi. (A) Representative phenotypes of 4 dpf zebrafish larvae following injections of std MO, mpi MO and p53 MO. mpi morphants are characterized by a small head, microphthalmia, pericardial edema, jaw defects and reduced liver size. Examples of normal, mild and severe phenotypes are shown. Co-injection of mpi MO and p53 MO, and injection of mpi MO into p53 MT larvae showed phenotypic rescue of mpi knockdown. (B) The cell death phenotype in mpi morphants, visualized by acridine orange staining, was reversed by co-injection of mpi and p53 morpholino. (C) Quantification of scoring of the phenotypes at 4 dpf, showing that 82% of mpi morphants injected with p53 MO, and 93% of p53 MT injected with mpi MO, were rescued to normal as compared with 22% normal in mpi MO larvae. p-values based on two-tailed Fisher’s exact test. (D) Western blot analysis showing that increase in p53 protein expression in mpi morphants was reduced by co-injection with p53 morpholino. Representative image of four separate clutches. (E) Mpi activity was not affected in either p53 MO co-injected embryos or with mpi MO in the p53 MT. p-Value based on two-tailed paired Student's t-test and Bonferroni correction was applied with alpha = 0.025; N.S. represents p-value>0.05. |

Cell death from loss of Mpi is rescued with p53 depletion. (A–C) Detection and quantification of apoptotic cell death in 24 hpf embryos injected with std and mpi MO by acridine orange staining observed under GFP (top row), and cleaved Caspase-3 immunofluorescence observed under RFP (bottom row). Scale bar = 100 µM. A standardized area of the tail was used for the quantification. A frame of 75 µm by 75 µm was set and superimposed on the image (white square in image) and positioned from the tip of the anal pore. Using Nikon's NIS-Elements software, cell death was quantified. Dead cells within the standardized area were counted as the total number of dead cells. (D) Quantification of cell death after acridine orange staining of 24 hpf zebrafish embryos co-injected with mpi and p53 MO, compared to each MO alone. The increase in cell death seen in mpi MO was rescued in the co-injected embryos. All p-values based on two-tailed paired Student's t test. |
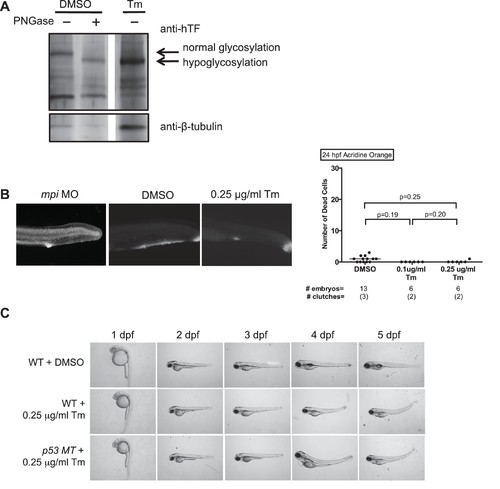
Tm-induced hypoglycosylation does not depend on p53. (A) Embryos from Tg(fabp10:hTf;cmlc2:EGFP) either treated with DMSO or 0.25 ug/mL Tunicamycin (Tm), and collected at 5 dpf. PNGase F digestion performed to show fully hypoglycosylated moiety. Western blot showing that transferrin (Tf) is hypoglycosylated with Tm treatment. Data representative of three distinct clutches. (B) Acridine orange staining with quantification of cell death (NIS-Elements software) showing minimal cell death in 0.1 or 0.25 µg/ml Tm-treated embryos at 24 hpf (tail shown), as compared to mpi MO. p-Values based on two-tailed paired Student's t test. (C) Time course of morphology of embryos treated with Tm in WT or p53 MT background. Data representative of four distinct clutches. |
|
ZFIN is incorporating published figure images and captions as part of an ongoing project. Figures from some publications have not yet been curated, or are not available for display because of copyright restrictions. PHENOTYPE:
|
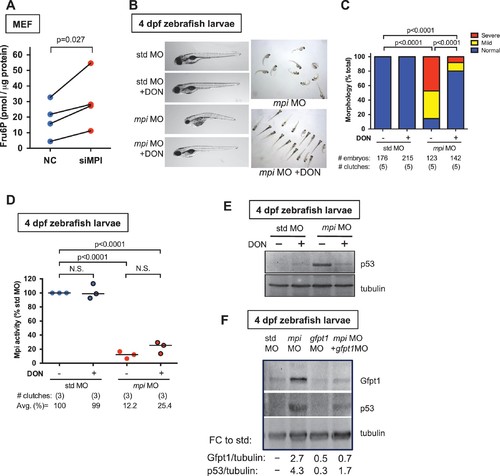
Loss of MPI stabilizes p53 through activation of the hexosamine biosynthetic pathway. (A) Measurement of Fru6P levels showed accumulation of Fru6P in siMPI MEFs compared to NC control. Values shown are normalized to total protein. p-Value based on paired ratio two-tailed Student’s t-test. (B) Representative phenotypes of 4 dpf zebrafish larvae following injections of std MO or mpi MO and treated with 20 μM of HBP inhibitor (DON) are shown. Enlarged (left) and group (right) images are shown. (C) Distribution of the morphological phenotypes was quantified in 4 dpf mpi morphants and std MO control injected embryos treated with or without DON. Morphological rescue was observed, as an increase in embryos with normal morphology in the presence of the inhibitor, compared to mpi morphants. Two-tailed Fisher’s exact test with the Bonferroni correction for multiple comparisons, with alpha = 0.017. (D) Mpi activity assay of 4 dpf zebrafish larvae injected with std MO or mpi MO and treated with 20 μM of DON showed that Mpi activity was not significantly affected by DON treatment. Two-tailed Student's t-test was applied with Bonferroni correction for multiple comparisons, with alpha = 0.0125. (E) Representative western blot for p53 protein in 4 dpf zebrafish larvae injected with std MO or mpi MO and treated with 20 μM DON showed a decreased p53 expression in mpi morphants treated with DON, compared to non-treated. DON treatment did not induce increase in p53 in std MO. Representative western blot for three independent clutches. (F) Western blot showing levels of Gfpt1 and p53 in 4 dpf zebrafish embryos injected with either std, mpi, gfpt1, or mpi MO + gfpt1 MO. Quantified relative to tubulin loading control, and compared to std MO. Representative western blot for four independent clutches. |
|
ZFIN is incorporating published figure images and captions as part of an ongoing project. Figures from some publications have not yet been curated, or are not available for display because of copyright restrictions. |