
- Title
-
miR-27 regulates chondrogenesis by suppressing Focal Adhesion Kinase during pharyngeal arch development
- Authors
- Kara, N., Wei, C., Commanday, A.C., Patton, J.G.
- Source
- Full text @ Dev. Biol.

Knock down of miR-27 leads to craniofacial and pectoral fin defects. (A,B) qRT-PCR for miR-27a-e at the indicated developmental stages normalized to U6 snRNA. Fold changes were calculated using ΔΔC(t) method comparing all miR-27 levels to miR-27c levels at the 3 somite stage (ss). Due to comparably higher levels, miR-27cexpression profile is shown separately. (C-E) Expression of miR-27a, miR-27b and miR-27c in 4dpf embryos detected by whole-mount in situ hybridization by locked nucleic acid (LNA) probes. All are ventral views of the head. (F,G) Dorsal view of 3 dpf live embryos injected with either 5 ng standard control morpholino (MO-ctl) or MO-27 at the single-cell stage. Pectoral fins are indicated with arrowheads. (H,I) Morphology of the head in 4 dpf embryos injected with either MO-ctl or MO-27. Lateral views, jaws are indicated with arrowheads. Scale bar, 300 µm. (J) miR-27 and U6 levels in uninjected control and miR-27 morpholino (MO-27) injected embryos at 48hpf detected by Northern blot. (K-P) Head cartilages stained with Alcian blue in 4dpf embryos injected with (K,L) standard control morpholino (MO-ctl), (M,N) 4-mismatch miR-27 morpholino (MO27-4mis) and (O,P) MO-27. Top panels, ventral views; bottom panels, lateral views. The indicated ratio represents the number of embryos with the represented phenotype/total number of observed embryos. Cartilage labels: ep, ethmoid plate; tc, trabeculae cranii; m, Meckel's cartilage; pq, palatoquadrate; ch, ceratohyal; hs, hyosymplectic; cb, ceratobranchial. Anterior side of the embryos is to the left. (Q,R) Staining of pectoral fin skeleton in 4dpf embryos by Alcian blue. The right side pectoral fin is shown with anterior to the top. The cleithrum (cl) and scapulocoracoid (sc) cartilages and postcoracoid process (pc) of pectoral fins are missing and the endoskeletal disc cartilage (ed) is smaller in miR-27morphants compared to the controls. Scale bar, 200 µm. EXPRESSION / LABELING:
PHENOTYPE:
|
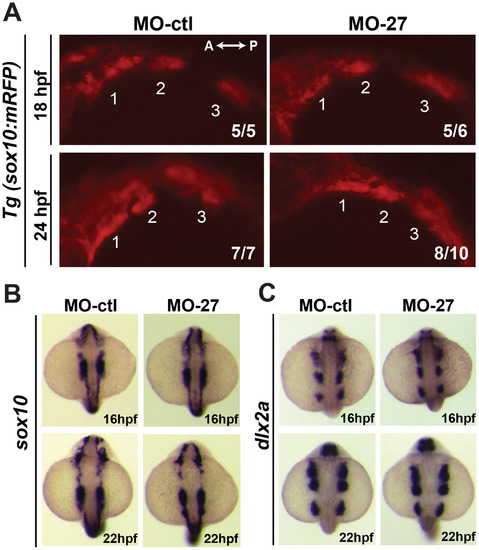
Early cranial neural crest (CNC) cell specification and migration are not affected in miR-27 morphants. (A) Lateral view of Tg(sox10(7.2):mRFP)vu234 embryos injected either with MO-ctl or MO27 showing cranial neural crest cell streams populating the pharyngeal arches at 18hpf and 24hpf. Anterior is to the left and posterior is to the right. Neural crest streams are numbered from 1 to 3. The indicated ratio represents the number of embryos with the represented phenotype/total number of observed embryos. (B,C) Expression of the neural crest cell marker, <\sox10\, and CNC marker dlx2a in MO-ctl and MO27 embryos at 16 hpf and 22 hpf detected by whole-mount in situ hybridization. Dorsal view of embryos with anterior side to the top EXPRESSION / LABELING:
PHENOTYPE:
|

Morphogenesis of the pharyngeal arches is disrupted in miR-27amorphants between 30 and 36hpf. (A) Live images of Tg(fli1a:eGFP)y1 embryos at 26, 30, 36, 48 hpf; lateral views with anterior to the left. Each pharyngeal arch is numbered. Embryos were injected with either 5 ng MO-ctl or MO-27 at the single cell stage and observed with confocal microscopy at the indicated stages. Time-lapse videos captured by spinning-disk confocal microscopy are shown in Supp. Movies 1 and 2. Scale bar, 100 µm. (B) Quantification of normalized and relative fli1a:eGFP fluorescence intensity in the pharyngeal arches of MO-ctl and MO-27 embryos at the indicated time points. The relative fluorescence intensities were normalized to the area of the arches selected and the fluorescence background in each image. Error bars indicate SEM and the number of embryos analyzed is indicated above the bars. For 26 hpf, n=3; for 30 hpf, n=5; for 36 hpf, n=4; for 48 hpf, n=4. Data represent three independent experimental trials. The n.s. non-significant, **p<0.01, ****p<0.0001 (Student's t-test). (C-D) Expression of the CNC marker dlx2a in embryos at 30 and 36 hpf. Embryos were injected with the corresponding morpholinos as described above. Pharyngeal arch expression domains are labeled. The indicated ratio represents the number of embryos with the represented phenotype/total number of observed embryos. Scale bar, 200 µm. |

miR-27 is required for differentiation of pre-chondrogenic crest (PCC) cells in pharyngeal arches. (A) Expression of the chondrogenic marker sox9a, the osteogenic marker, runx2b, and the chondrocyte-specific marker col2a1a in MO-ctl or MO-27 (5 ng) injected embryos, detected by whole-mount in situ hybridization. Arrowheads indicate the expression domain of the ceratobranchial arches. All panels except the top panel for col2a1a are lateral views. Top panel for col2a1a expression is a ventral view with the first pharyngeal arch indicated by an arrowhead. (B) Anti-Col2 and anti-GFP immunostaining in the pharyngeal arch region between the eye and otic vesicle (ov) in Tg(fli1a:eGFP)y1 embryos at 61hpf. A single optical section of the confocal stacks is shown in each image, with anterior to the left. Embryos were injected with the corresponding morpholinos as described above. (C) Wheat-germ agglutininstaining and anti-GFP immunostaining in the pharyngeal arch region between the eye and otic vesicle (ov) in Tg(fli1a:eGFP)y1 embryos at 61hpf. The indicated ratio represents the number of embryos with the represented phenotype/total number of observed embryos. Scale bar, 50 µm. EXPRESSION / LABELING:
PHENOTYPE:
|

miR-27 knock-down impairs proliferation and survival of PCC cells. (A) Anti-phospho histone 3 (pH3) and anti-GFP immunostaining in Tg(fli1a:eGFP)y1 embryos at 32 and 36 hpf. Embryos were injected with either 5 ng MO-ctl or MO-27 at the single cell stage. Lateral view with anterior to the left. (B) Quantification of pH3+GFP+ cells normalized to the GFP+ area in each embryo. For 30 hpf, n=7; for 36 hpf, n=8. (C) TUNEL staining and anti-GFP immunostaining in Tg(fli1a:eGFP)y1 embryos at 36 and 54 hpf. Embryos were injected with the corresponding morpholinos and image layouts are as described above. (D) Quantification of TUNEL+GFP+ cells normalized to the GFP+ area in each embryo. Error bars indicate SEM. For 36 hpf, n=9; for 54 hpf, n=5. *p<0.05, ***p<0.001 (Student's t-test). Data are from four independent experiments. Scale bars, 100 µm. |

miR-27 targets FAK and regulates FAK levels in vivo. (A) Schematic of the reporter mRNA consisting of the coding sequence of GFP fused to the ptk2aa 3′UTR. Two predicted miRNA recognition elements (MREs) are indicated. Predicted base-pairing between MREs (shown in green) and the miR-27a sequence (shown in red). (B) Embryos injected with either GFP-ptk2aa 3′UTR reporter mRNA alone or co-injected with miR-27a imaged at 24hpf. (C) Reporter assays with GFP-ptk2aa 3′UTR mRNA containing mutations in the miR-27 seed sites. (D) Western blots with anti-GFP and anti-tubulin antibodies using the lysates from embryos injected with the GFP-ptk2aa 3′UTR reporter mRNA alone or co-injected with miR-27a. (E) Quantification of GFP levels by Western blots normalized to the levels of tubulin. (F) Western blots with anti-FAK and anti-GAPDH antibodies using lysates from 24hpf embryos either uninjected or injected with 100 or 200 pg miR-27a. (G) Western blots with anti-FAK and anti-GAPDH antibodies using lysates from 48hpf embryos injected either with MO-ctl or MO-27. (H) Quantification of FAK levels from Western blots shown in (G) normalized to the levels of tubulin. At least 20 embryos were pooled for protein lysates. Error bars indicate SEM. **p<0.01 (Student's t-test). |

Suppressing FAK in miR-27 morphants partially rescues cartilage defects. (A) Three categories of representative head cartilage phenotypes in 4dpf old embryos injected with MO-27, along with either standard control morpholino MO-ctl or translation blocking MO-ptk2 at the single-cell stage. Ventral views of head cartilage stained with alcian blue. Ceratohyal cartilage indicated by an arrowhead and Meckel's cartilage indicated with an arrow. (B) Embryos were injected with 2 ng or 4 ng MO-27 either co-injected with 3 ng MO-ctl or MO-ptk2. Percentage of embryos with the corresponding head cartilage phenotypes (CH1-CH3) at 4dpf. The distribution of phenotypes in MO-ptk2 and MO-27 injected embryos are compared to those injected with MO-ctl and MO-27. ***p<0.0001 (Chi-squared goodness of fit test), n=40–60 embryos. Data are from three independent experiments. (C) Analysis of cartilage positions. Ventral view of head cartilages in wild-type embryos stained with alcian blue. A represents the distance between the palataquadrate (pq) and ceratohyal (ch) cartilage joints. B represents the distance from the anterior joint of the two ceratohyals to the baseline shown by a dashed line. C represents the distance from the anterior end of Meckel's cartilage (m) to the baseline. (D) (C-B)/A ratio was calculated for quantitative analysis of anterior-posterior extension of the ceratohyal cartilage. This ratio increases as the ceratohyal position extends posteriorly instead of anteriorly. Percentage increase of the (C-B)/A ratio in MO-27 and MO-ctl injected embryos or embryos co-injected with both MO-27 and MO-ptk2 compared to the ratio in wild-type embryos. Error bars represent SEM. n=40–60 embryos, **p<0.01 (student's t-test). PHENOTYPE:
|
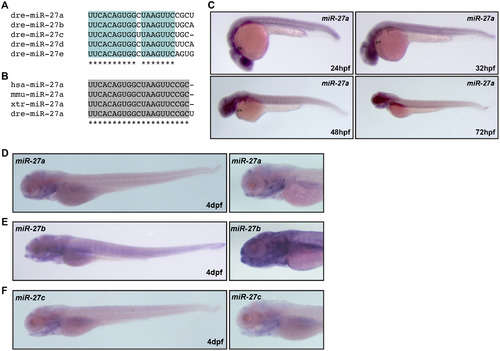
miR-27 is a highly conserved miRNA with enriched expression in the pharyngeal arches. (A) Alignment of the zebrafish miR-27a-e sequences by ClustalW2, with conserved regions highlighted in blue and indicated with stars. (B) Alignment of miR-27a sequences from human (hsa), mouse (mmu), xtr (Xenopus), and dre (zebrafish). (C) miR-27a expression in embryos between 24 hpf to 72 hpf, detected by whole-mount in situ hybridization. Expression of miR-27a (D), miR-27b (E), miR-27c (F), in 4dpf embryos detected by whole-mount in situ hybridization. Lateral views with images on the right are closed up views of the head. |

Dose-dependent changes in cartilage defects by mature miR-27knock-down. (A) Head cartilage staining by alcian blue of 4 dpf old embryos injected with different doses of the MO-27 morpholino. (B) Head cartilage staining by alcian blue of 4 dpf old embryos injected with different doses of the MO-27-4MM morpholino that is complementary to the mature miR-27 with 4 base-pair mismatches. All are ventral views and the ratio of the observed phenotype to the total number of embryos is shown for each image. |
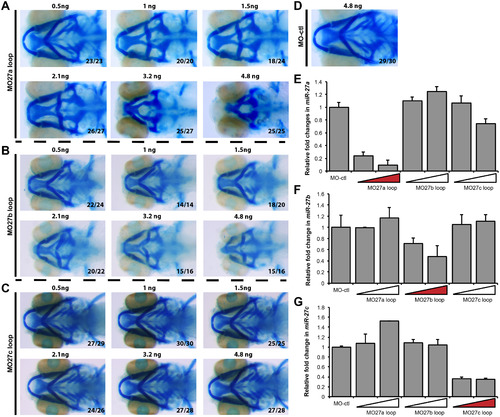
Dose-dependent changes in cartilage defects by mature miR-27 a, b and cknock-down. Head cartilage staining of 4 dpf old embryos injected with different doses of the MO-27a loop (A) MO-27b loop (B) MO-27c loop (C) morpholinos complementary to the loop and Dicer cleavage site of the corresponding precursor miR-27. All are ventral views and the ratio of the observed phenotype to the total number of embryos is shown for each image. (D) Alcian blue staining of the 4dpf embryos injected with 4.8 ng MO-ctl. qRT-PCR of miR-27a (E), miR-27b (F), and miR-27c (G) in 30hpf old embryos injected with 4.8 ng MO-ctl, MO27a loop, MO27b loop, and MO27c loop at either 2.4 ng or 4.8 ng. |

Conditional and neural crest-specific miR27 overexpression does not lead to any defects in pharyngeal arch morphogenesis. (A) Alcian blue staining of heat shocked Tg(hsp70:miR-27b-eGFP) and wild-type siblings. Heat shock was performed at 24 hpf and embryos were fixed and stained at 4dpf. Images are ventral views of the head cartilage and the ratio of the observed phenotype to the total number of embryos is shown for each image. (B) qRT-PCR of miR-27b in 72hpf old Tg(hsp70:miR-27b-eGFP) and wild-type siblings. Relative miR-27b levels were normalized to control U6 snRNA. |
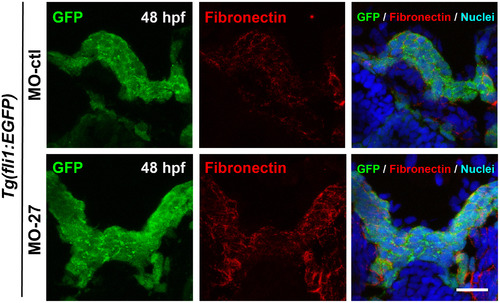
Fibronectin matrix of pre-chondrogenic crest (PCC) cells during mesenchymal condensation is not affected by miR-27 knock down. Anti-fibronectin and anti-GFP immunostaining in transverse sections of Tg(fli1a:eGFP)y1 embryo heads at 48hpf. Embryos were injected with either 5 ng MO-ctl or MO-27 at the single cell stage. TOPRO-3 was used as a nuclei marker. |
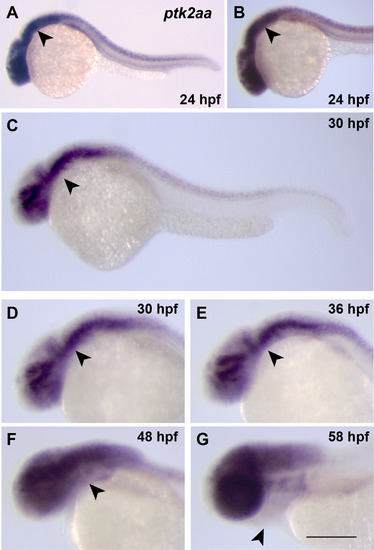
Expression pattern of ptk2aaduring development. (A-G) ptk2aa expression in embryos between 24 hpf and 58 hpf, detected by whole-mount in situ hybridization. Lateral views with the pharyngeal arch primordia indicated by an arrowhead. |

PCC cells in the pharyngeal arches have low levels of active FAK (pY397-FAK) at 36 and 48 hpf. (A) Schematic of a transverse cross-section of the zebrafish head at 36 hpf. M, mesencephalon; H, hypophysis; E, eye; PA, pharyngeal arch. Dorsal (D) is to the top, ventral (V) is to the bottom. (B) Anti-phospho FAK (pY397-FAK) and anti-GFP immunostaining on transverse sections of Tg(fli1a:eGFP)y1 embryos at 36 and 48 hpf. PCC cells in the pharyngeal arch (PA) region are indicated by arrowheads. Scale bar, 50 µm. (C) Anti-phospho FAK (pY397-FAK), anti-phalloidin (to label cell borders) and nuclear TO-PRO-3 immunostaining on transverse sections of telencephalon in wild-type embryos at 29 hpf. Embryos were injected with either 3 ng MO-ctl or MO-ptk2 at the single cell stage. The indicated ratio represents the number of embryos with the represented phenotype/total number of observed embryos. Scale bar, 10 µm. |

Ptk2 morpholino targets the translation start site of the ptk2aa. (A) Design of the reporter construct (MOptk2 BS-GFP) that carries the ptk2aa 5′UTR carrying the translation start site fused to the open reading frame of GFP without the translation start site. This construct carries the SP6 promoter that enables in vitro transcription. (B-C) Live images of 1 dpf embryos injected with MOptk2 BS-GFP mRNA. (D-E) Live images of 1 dpf embryos injected with MOptk2 BS-GFP mRNA and ptk2a morpholino (MO-ptk2). |

miR-27amutants have pharyngeal cartilage defects upon partial knock-down ofmiR-27b. (A) Schematic representation of the miR-27a precursor and generation of miR-27a mutants by CRISPR/Cas9. The blue box on the miRNA precursor represents the gRNA target region corresponding to the mature miR-27a seed. (B) The region of the miR-27a gene sequence that shows the CRISPR/Cas9 targeted region. miR-27a-5p and miR-27a-3p are shown in red. The seed region of mature miR-27a is shown in the grey box. The target region for the designed sgRNA is underlined in green. Arrow points to the PAM sequence. (C) Alcian blue staining of 4 dpf miR-27aΔ/Δ and WT siblings injected with 1.5 ng of MO-27b loop at the one-cell stage. (D) Phenotypic categorization of the pharyngeal cartilage in 4dpf miR-27aΔ/Δ, miR-27a+/Δ and WT siblings injected with 1.5 ng of MO-27b loop at the one-cell stage. n=20 for WTs, n=36 for miR-27a+/Δ and n=20 in miR-27aΔ/Δ. (E) Analysis of cartilage positions. Ventral view of head cartilage in wild-type embryos stained with alcian blue. A represents the distance between the palataquadrate (pq) and ceratohyal (ch) cartilage joints. B represents the distance from the anterior end of Meckel's cartilage (m) to the baseline. (F) The B/A ratio was calculated for quantitative analysis of anterior-posterior extension of the Meckel's cartilage. Error bars represent SEM. Statistical analysis was done using one-way ANOVA with Fisher's Least Significant Difference (LSD) test, *p<0.05. |
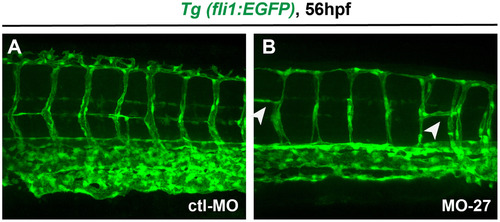
Vasculature defects in miR-27 morphants. Vasculature patterning in live Tg(fli1a:eGFP)y1 embryos at 56 hpf. Embryos were injected with either MO-ctl or MO-27 at the single cell stage. Arrowheads indicate branching defects in the intersegmental vessels in miR-27 morphants. |
Reprinted from Developmental Biology, 429(1), Kara, N., Wei, C., Commanday, A.C., Patton, J.G., miR-27 regulates chondrogenesis by suppressing Focal Adhesion Kinase during pharyngeal arch development, 321-334, Copyright (2017) with permission from Elsevier. Full text @ Dev. Biol.