
- Title
-
Transcriptional Complexity and Distinct Expression Patterns of auts2 Paralogs in Danio rerio.
- Authors
- Kondrychyn, I., Robra, L., Thirumalai, V.
- Source
- Full text @ G3 (Bethesda)

ZFIN is incorporating published figure images and captions as part of an ongoing project. Figures from some publications have not yet been curated, or are not available for display because of copyright restrictions. EXPRESSION / LABELING:
|
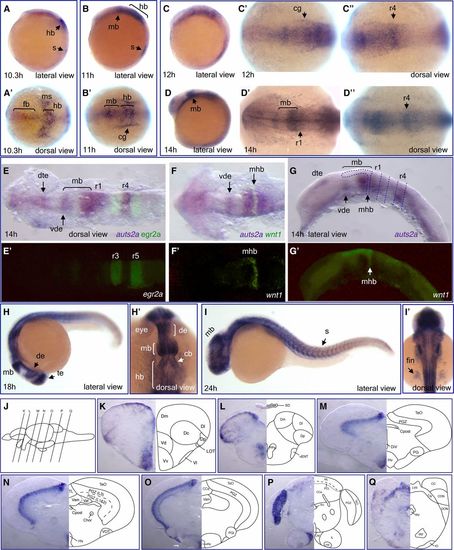
Expression of auts2a mRNA during zebrafish development. Whole-mount in situ hybridization analysis of auts2a-i3 transcript expression in wild-type embryos at different developmental stages: 10.3 hr (A and A’), 11 hr (B and B’), 12 hr (C–C''), 14 hr (D–D''), 18 hr (H and H'), and 24 hr (I and I'). (E–G') Double in situ hybridization with egr2a (krox20) (E and E’) and wnt1 (F' and G’) as second probes. In (G), dotted lines approximately demarcate rhombomere borders and midbrain. (K–Q) Transverse sections at the levels indicated by the vertical lines in (J) show auts2a-i3 mRNA expression in different regions of the juvenile brain: telencephalon (K and L), diencephalon and midbrain (M–O), and hindbrain (P and Q). Abbreviations used to label areas in brain sections can be found in Table S1. cb, cerebellum; cg, cranial ganglia; de, diencephalon; dte, dorsal telencephalon; fb, forebrain; hb, hindbrain; mb, midbrain; mhb, midbrain-hindbrain boundary; ms, mesoderm; r, rhombomere; s, somite; te, telencephalon; vde, ventral diencephalon. EXPRESSION / LABELING:
|

Expression of auts2b mRNA during zebrafish development. (A) RT-PCR analysis of auts2b expression during development (amplicon size is 3.25 kb). Numbers shown below each lane indicate sample age in hours post fertilization. (B–F'', I, I', and K–L'): Whole-mount in situ hybridization analysis of auts2b transcript expression in wild-type embryos at different developmental stages: 9 hr (B and B'), 10.3 hr (C and C'), 11 hr (D and D'), 12 hr (E–E''), 14 hr (F–F''), 18 hr (I and I'), 24 hr (K and K'), and 48 hr (L and L'). (G–H'', J, and J') Double in situ hybridization with egr2a (krox20) (G–G''), otx2 (H–H''), and sim1a (J and J’) as second probes. de, diencephalon; dth, dorsal thalamus; fb, forebrain; hb, hindbrain; mb, midbrain; mhb, midbrain-hindbrain boundary; r, rhombomere; rp, roof plate; RT-PCR, reverse transcription-polymerase chain reaction; s, somites; te, telencephalon; vde, ventral diencephalon; vth, ventral thalamus. EXPRESSION / LABELING:
|
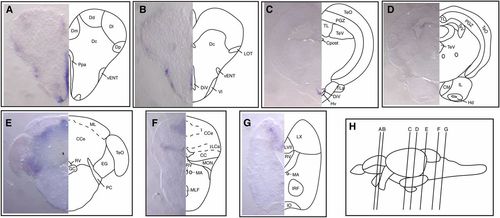
Expression of auts2b mRNA in juvenile brain. (A–G) Transverse sections at the levels indicated by the vertical lines in (H) show auts2b mRNA expression in different regions of the juvenile brain: telencephalon (A and B), diencephalon and midbrain (C and D), and hindbrain (E–G). Abbreviations used to label areas in brain sections can be found in Table S1. EXPRESSION / LABELING:
|
|
ZFIN is incorporating published figure images and captions as part of an ongoing project. Figures from some publications have not yet been curated, or are not available for display because of copyright restrictions. EXPRESSION / LABELING:
|

Expression of fbrsl1 mRNA during zebrafish development. Whole-mount in situ hybridization analysis of fbrsl1-i2b transcript expression in wild-type embryos at different developmental stages: 10.3 hr (A and A'), 11 hr (B and B'), 12 hr (C–C''), 14 hr (D–D''), 18 hr (F, I, and I'), 24 hr (G, J, and J''), and 48 hr (H, K, and K'). (E and E') Double in situ hybridization with egr2a (krox20) as a second probe. (I, I'–K, and K'). Flat mount prep of embryonic brain with schematic presentation of brain subdivision at these developmental stages (I''–K''). Eyes were removed in (I'–K'). c, cerebellum; cg, cranial ganglia; de, diencephalon; dt, dorsal thalamus; e, epiphysis; fb, forebrain; hb, hindbrain; hy, hypothalamus; kv, Kupffer's vesicle; mb, midbrain; pt, posterior tuberculum; r, rhombomere; t, telencephalon; tc, tectum; tg, tegmentum; vt, ventral thalamus. EXPRESSION / LABELING:
|

Expression of fbrsl1 mRNA in juvenile brain. (A–F) Transverse sections at the levels indicated by the vertical lines in (G) show fbrsl1-i2b mRNA expression in different regions of the juvenile brain: telencephalon (A), diencephalon and midbrain (B and C), and hindbrain (D–F). Abbreviations used to label areas in brain sections can be found in Table S1. EXPRESSION / LABELING:
|

Gene structure, transcript complexity, and expression of the fbrs gene during zebrafish development and in the juvenile brain. (A) Schematic presentation of the 20.5 kb long fbrs genomic region on chromosome 12 (not to scale). Exons are shown as bars. Arrows show TSSs identified either in this study (blue) or annotated based on RNASeq data (purple). (B) Schematic presentation of structure of fbrs transcript identified in this study. Structures of RNASeq transcripts transcribed from alternative TSSs are shown in purple. RNASeq transcript IDs are shown in Table S5. Noncoding and coding exons are depicted as open and filled bars, respectively. (C) RT-PCR analysis of fbrs expression during zebrafish development. Primers amplifying the full-length transcripts were used for analysis. The second faint bands are reverse transcriptase template switching artifacts. (D) Partial DNA sequence of alternatively spliced exon 12. Position of alternative 3′ acceptor splice site is highlighted in orange. Constitutive splice site is underlined. Deleted amino acids are shown in red. (E–J) Whole mount in situ hybridization analysis of fbrs transcript expression in wild-type embryos at different developmental stages, from 1-somite (10.3 hr) to long-pec (48 hr) stages. Arrows point to expression in Kupffer’s vesicle. (L–O) Expression of fbrs mRNA in juvenile brain. Transverse sections were made at the levels indicated by the vertical lines in (K). Abbreviations used to label areas in brain sections can be found in Table S1. ID, identifier; RNASeq, RNA sequencing; RT-PCR, reverse transcription-polymerase chain reaction; TSS, transcription start site. EXPRESSION / LABELING:
|

Whole mount in situ hybridization with sense riboprobes |
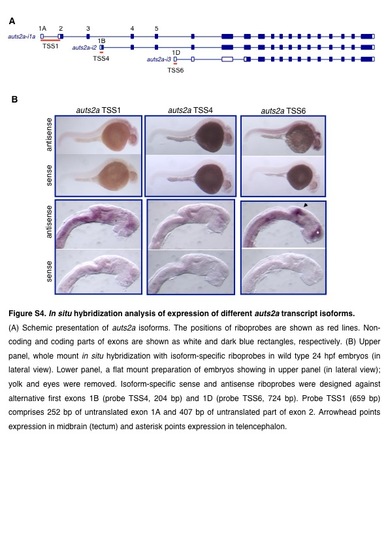
In situ hybridization analysis of expression of different auts2a transcript isoforms. (A) Schemic presentation of auts2a isoforms. The positions of riboprobes are shown as red lines. Noncoding and coding parts of exons are shown as white and dalk blue rectangles, respectively. (B) Upper panel, whole mount in situ hybridization with isoform-specific riboprobes in wild type 24 hpf embryos (in lateral view). Lower panel, a flat mount preparation of embryos showing in upper panel (in lateral view); yolk and eyes were removed. lsoform-specific sense and antisense riboprobes were designed against alternative first exons 18 (probe TSS4, 204 bp) and 1D (probe TSS6, 724 bp). Probe TSS1 (659 bp) comprises 252 bp of untranslated exon 1 A and 407 bp of untranslated part of exon 2. Arrowhead points expression in midbrain (tectum) and asterisk points expression in telencephalon. |

In situ hybridization analysis of expression of different fbrsl1 transcript isoforms. A) Schemic presentation of fbrsl1 isoforms. The positions of riboprobes are shown as red lines. Noncoding and coding parts of exons are shown as white and dark blue rectangles, respectively. Exons 9a and 9b are mutually exclusive exons. (8-C) left panels, whole mount in situ hybridization with isoformspecific riboprobes, TSS1 (B) and TSS2 (C) in wild type 24 hpf embryos. Right panels, a flat mount preparation of embryos showing in left panels; yolk and eyes were removed. lsoform-specific sense and antisense riboprobes were designed against alternative first exons 1A (TSS1, 883-bp long probe comprising 849 bp of 5'UTR and 34 bp of coding region) and exon 1 B (probe TSS2, 652 bp). Arrow points hypothalamus, arrowhead points ventral diencephalon and asterisk points telencephalon. |

Comparative expression of auts2 paralogs Expression of auts2a (A, A'), fbrsl1 (B,B'), and auts2b (C,C') mRNAs during neural keel formation. Dotted lines outline rhombomere boundaries in hindbrain and also demarcate midbrain territory. cg, cranial ganglia; dte, dorsal telencephalon; mb, midbrain; mhb, midbrain-hindbrain boundary; r, rhombomere; vde, ventral diencephalon. |