
- Title
-
The signalling receptor MCAM coordinates apical-basal polarity and planar cell polarity during morphogenesis
- Authors
- Gao, Q., Zhang, J., Wang, X., Liu, Y., He, R., Liu, X., Wang, F., Feng, J., Yang, D., Wang, Z., Meng, A., Yan, X.
- Source
- Full text @ Nat. Commun.
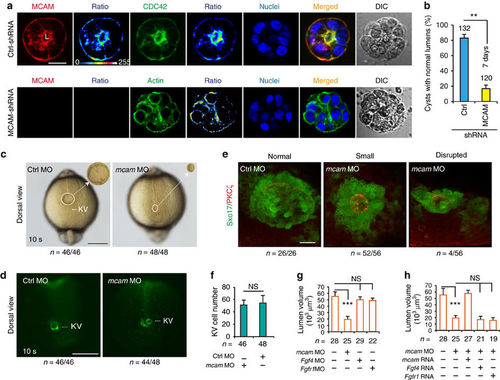
Mcam depletion disrupts lumenogenesis. (a,b) HEK293 cells transfected with either control pGPU6/Neo-shRNA vector or pGPU6/Neo-MCAM-shRNA were cultured on Matrigel for 5–7 days to enable cyst formation. Cyst nuclei and F-actin were labelled with DAPI and phalloidin, respectively. DIC means digital image of contrast. The fluorescent images were converted to 16-colour intensity images indicating the localization of MCAM, CDC42, or F-actin (calibration bar: signal intensity). L, lumen space; Scale bar, 20 μm. Data (mean±s.e.m., n=3) were analysed with unpaired Student’s t-test. **P value<0.01. (c,d) KV in Sox17:GFP zebrafish TG embryos injected with mcam MO or control MO into DFC. Embryos were collected at 10 s (somite) stage. In representative light micrographs (c), the area with KV was enlarged 4 times and shown as inset in the right hand corner. Scale bar, 250 μm. (e) mcam MO was injected into DFC of Sox17:GFP transgenic embryos. Lumen cells were immunolabeled with aPKC antibody (red). Representative fluorescence images show Sox17-GFP-labelled KV (green) and lumen cells (red). Scale bar, 20 μm. (f) KV cell numbers in DFCmcam MO embryos. Data (mean±s.e.m., n=3) were analysed with unpaired Student’s t-test and NS, not significant. (g) Comparison of KV lumen volumes in embryos with DFC injection of mcam, fgf4 or fgfr1 MO. KV lumen volumes were calculated using the measure stack tool of Image J software. Data are presented as mean±s.e.m. (n=3). One-way analysis of variance (ANOVA) with Tukey’s post-test. ***P value<0.001 and NS, not significant. (h) Rescue effects of mcam, fgf4 or fgfr1 mRNA on reduction of lumen volumes in DFCmcam MO embryos. Data are presented as mean±s.e.m. (n=3). One-way ANOVA with Tukey’s post-test. ***P value<0.001 and NS, not significant. EXPRESSION / LABELING:
PHENOTYPE:
|

Mcam depletion in DFC disrupts ciliogenesis and direction of KV fluid flow in zebrafish. (a) KV cilia labelled with an antibody against acetylated tubulin after DFC injection of embryos with control or mcam MO, mcam mRNA or a combination of mcam MO and mRNA. Scale bar, 20 μm. (b) Mean cilia length in (a) is statistically analysed. Data are presented as mean±s.e.m. One-way ANOVA with Tukey’s post-test. **P value<0.01 and ***P value<0.001. (c) Mean cilia number (mean±s.e.m.) of embryos in a was determined. (d) Comparison of cilia length in embryos with DFC injection of mcam, fgf4 or fgfr1 MO. Data are presented as mean±s.e.m. One-way ANOVA with Tukey’s post-test. ***P value<0.001. (e,f) Failure of mcam mRNA to rescue fgf4 MO (e) or fgfr1 MO (f) induced reduction in cilia length. Data are presented as mean±s.e.m (n=3) and analysed using one-way ANOVA with Tukey’s post-test. ***P value<0.001 and NS, not significant. (g) Direction of KV fluid flow tracked with fluorescent beads in control and DFCmcam MO embryos. Scale bar, 20 μm. (h) Randomized expression of left side-specific spaw in DFCmcam MO morphants. Scale bar, 250 μm. (i) Quantitative analysis of embryos with normal (left-sided), reversed (right-sided), cardia bifida (bilateral) and absent expression. n, number of embryos (b-f, i). EXPRESSION / LABELING:
PHENOTYPE:
|
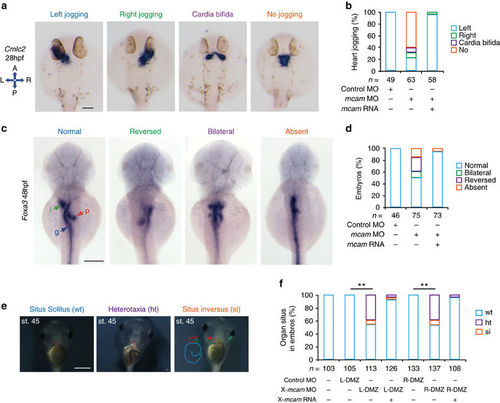
Mcam regulation of left-right asymmetric development in zebrafish and Xenopus. (a–d) Developing organs in DFCmcam MO morphants were visualized by WISH using RNA probes of cmlc2 (a, heart) and foxa3 (c, endoderm). Quantitative analysis of embryos with normal, reversed, bilateral and absent asymmetry is shown in b,d. n, number of embryos. The left schema in a shows embryo positions in the embryo (A, anterior; P, posterior; L, left; and R, right). In c, l (green arrow)=liver, p (red arrow)=pancreas and g (blue arrow)=gut. H.p.f., hours post-fertilization. Scale bars in a,c , 100 μm. (e) Xmcam-MO (1 pM) caused situs defects at stage 45, in Xenopus embryos including heterotaxia (ht) and situs inversion (si) compared with the wild type (wt) situs solitus. Heart looping and position is outlined by red dots or red arrow, respectively. Gut coiling is outlined by light blue dots. Position of gall bladder is indicated by green auto-fluorescence and a green arrow. Scale bar, 1 mm. (f) Organ situs in Xenopus embryos at tadpole stage injected as specified. Injections were performed in left or right side of dorsal marginal zone (L- or R-DMZ) at the 4-cell stage. Data are presented as mean±s.e.m. Pearson’s chi-square tests and **P value<0.01. n, number of embryos. |

MCAM controls lumenogenesis by activation of NFAT. (a) Detecting the expression of RFP-HA and VIVIT-RFP-HA in HEK293 cells by IB. (b) VIVIT selectively inhibiting NFAT reporter activity. Jurkat cells were co-transfected with NFAT-Luc (left panel) or NF-kB-Luc (right panel) reporter plasmid, and with RFP and RFP-VIVIT expression plasmids. Twenty-four hours after transfection, cells were left untreated or were stimulated for 6 h with phorbol 12-myristate 13-acetate (PMA; 20 nM) and ionomycin (1 mM) (P+I). (c) Calcineurin dependence of NFAT and NF-kB reporter activity. Jurkat cells were transfected with NFAT-Luc (left panel) or NF-kB-Luc (right panel) reporter plasmid. Twenty-four hours after transfection, cells were left unstimulated or were stimulated for 6 h with P+I in the absence or presence of 1 μM cyclosporin (CsA). (d) Both RFP-tag and VIVIT-RFP were localized and expressed in DFC after microinjection of RFP and RFP-VIVIT mRNA into DFC of zebrafish KV. DIC means digital image of contrast. (e,f) Messenger RNAs were injected into zebrafish DFC of Sox17:GFP transgenic embryos, which were harvested at the 10 s stage. Lumen cells were labelled with an antibody against aPKCζ (red). Data are presented as mean±s.e.m. One-way ANOVA with Tukey’s post-test. ***P value<0.001 and NS=not significant. (g,h) KV cilia were labelled with an antibody against acetylated tubulin after injection of the indicated mRNAs. Data are presented as mean±s.e.m. and analysed using unpaired student’s t-test. The NS means not significant. (i) Quantitative analysis of heart joggings after injection of the indicated mRNAs into DFC of Sox17:GFP zebrafish embryos. Normal (left), reversed (right) and absent (no) jogging were calculated. Scale bar, 20 μm. n, number of observed embryos (e-i). |
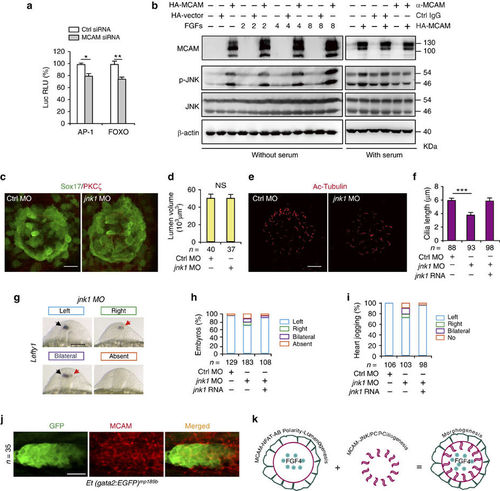
MCAM-dependent JNK activation regulates ciliogenesis. (a) Luciferase activity measured 30 h post transfection. AP-1-Luc or FOXO-Luc reporter vectors were co-transfected with either MCAM RNAi or control RNAi. Data (mean±s.e.m.) were analysed with unpaired student’s t-test. *P value<0.05 and **P value<0.01. (b) Phosphorylation and expression of JNK following overexpression of MCAM by transfection with pCS2-MCAM-HA or blockage of MCAM by its functional antibody AA98. (c,d) DFC-specific knockdown of jnk1 did not affect lumen formation in Sox17:GFP zebrafish embryos. Lumen cells were labelled with an antibody against aPKCζ (red). Scale bar, 20 μm. Data (mean±s.e.m.) were analysed with unpaired student’s t-test. The NS means not significant. (e,f) DFC-specific knockdown of jnk1 shortened KV cilia. The cilia were labelled with acetylated tubulin antibody. Scale bar, 20 μm. Data (mean±s.e.m.) were analysed using one-way ANOVA with Tukey’s post-test. ***P value<0.001. (g,h) Randomized expression of left side-specific lefty1 in the DFCjnk1 MO morphants. Scale bar, 100 μm. (i) Quantitative analysis of embryos with normal (left-sided), reversed (right-sided), cardia bifida (bilateral) and absent expression. n, number of embryos (d,f,h,I,j). (j) MCAM is localized at the zebrafish PLL system. Embryos of Et (gata2:EGFP) mp189b zebrafish line at the 28 h.p.f. stage were collected and stained with MCAM antibody. Scale bar, 15 μm. (k) A model of MCAM-mediated coordination of cell polarity during morphogenesis. See text for details. EXPRESSION / LABELING:
PHENOTYPE:
|
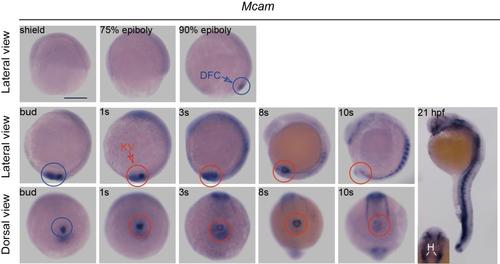
The spatiotemporal distribution ofmcam mRNAin zebrafish embryos. Zebrafish mcam mRNA expression was measured in DFCs (blue circles) and in KV (red circles) of wild-type embryos. At 21 hour post fertilization (hpf), mcam was expressed at blood vasculature, heart, somite, and eye field. The inset indicates expression of mcam mRNA in the heart. Inset: H, heart. Scale bar, 250 μm. EXPRESSION / LABELING:
|
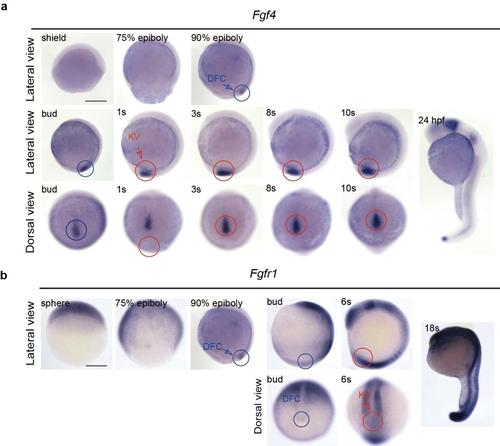
The spatiotemporal distribution of the mRNA of fgf4 andfgfr1 in zebrafish embryos. (a) Fgf4 was predominantly expressed in DFCs (blue circles), KV (red circles) and its peripheral region. Fgf4 was also detected at the posterior notochord. At 24 hpf,fgf4 was expressed in the midbrain–hindbrain boundary, pharyngeal arch and tail bud. (b) Weak expression of fgfr1 RNA was detected in DFCs (blue circles) and in KV (red circles) of wild-type embryos. At 6s stage, fgfr1 was also expressed in mesoderm, somite, eye field and hindbrain. The mRNA was detected in wild-type embryos by WISH. Lateral views show dorsal to the right and the head from the top; dorsal views show the head from the top. s, somite. Scale bar, 250 μm. |
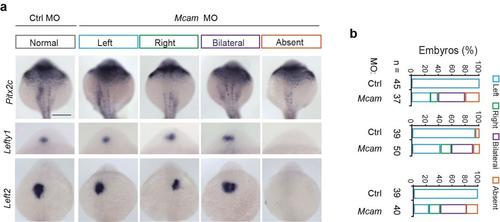
MCAM dictates the expression of left side-specific genes in correct localization. (a) Randomized expression of left side-specific target genes of pitx2 and lefty1 and 2 in mcam morphants. Scale bar, 250 μm.(b) Quantitative analysis of embryos with normal (left-sided), reversed (right-sided), bilateral, and absent expression. |

Jnk1 depletion had no effects on KV lumen formation. (a) Jnk1 mRNA was detected in KV of wild-type embryos by WISH. Scale bar, 250 μm. (b) Embryos injected with jnk1 or control MO at the 1-4-cell stage. Embryos were harvested at the 10s stage. The KV is delineated by circles or semi-circles in light micrographs of the live embryos.Scale bar, 300 μm. |

Jnk1 depletion-resulted in randomized expression of left side specific spaw and its target genes. Embryos were injected with jnk1 or control MO at the 1-4-cell stage and harvested at the 10s stage. (a) Randomized expression of left side-specific spaw and its target genes of pitx2c, lefty1 and lefty2 in jnk1morphants.Scale bar, 100 μm.(b) Quantitative analysis of embryos with normal (left-sided), reversed (right-sided), and bilateral expression. |

Endogenous MCAM is localized at KV and otic vesicle. (a) Embryos of Tg(sox17:GFP) zebrafish line was harvested at the 28 hpf stage and the KV was stained with MCAM antibody. (b) Embryos of Et (gata2:EGFP) mp189b zebrafish line was harvested at the 28 hpf stage and the otic vesicle was stained with MCAM antibody.The nucleus was stained with DAPI. Scale bars: 30 μm a; 50μm in b. |