
- Title
-
Interrupted Glucagon Signaling Reveals Hepatic α Cell Axis and Role for L-Glutamine in α Cell Proliferation
- Authors
- Dean, E.D., Li, M., Prasad, N., Wisniewski, S.N., Von Deylen, A., Spaeth, J., Maddison, L., Botros, A., Sedgeman, L.R., Bozadjieva, N., Ilkayeva, O., Coldren, A., Poffenberger, G., Shostak, A., Semich, M.C., Aamodt, K.I., Phillips, N., Yan, H., Bernal-Mizrachi, E., Corbin, J.D., Vickers, K.C., Levy, S.E., Dai, C., Newgard, C., Gu, W., Stein, R., Chen, W., Powers, A.C.
- Source
- Full text @ Cell Metab.

mTOR Signaling and FoxP Transcription Factor Are Essential for α Cell Proliferation in Response to Interrupted Glucagon Signaling (A–C) Fasting blood glucose (mg/dL) (n = 5; A), serum glucagon (pg/mL) (n = 5; B), and α cell proliferation (n = 3; C) in mice after cotreatment with GCGR mAb and rapa. Saline/PBS treated (white bars), saline/GCGR mAb treated (blue bars), rapa/PBS treated (white left hashed bars), and rapa/GCGR mAb treated (blue left hashed bars) are shown. ∗p < 0.05, ∗∗p < 0.01, and ∗∗∗p < 0.001 versus PBS treated and #p < 0.05, ##p < 0.01, and ###p < 0.001 versus saline treated. (D and E) Representative images of pancreatic islet α cell proliferation in saline/GCGR mAb- and rapa/GCGR mAb-treated mice. Glucagon (green), Ki67 (red), and DAPI (blue) are shown. White scale bars represent 100 μm. White dashed boxes indicate region selected for insets. (F and G) Representative images of pancreatic islet α cell expression of pS6 protein in saline/GCGR mAb- and rapa/GCGR mAb-treated mice. Glucagon (green), pS6(pS235/S236) (red), and DAPI (blue) are shown. (H) α cell number in 7 dpf (days post-fertilization) wild-type and gcgra−/−gcgrb−/− zebrafish larvae primary islet after treatment with rapa for 3 days. Wild-type/vehicle treated (white), gcgra−/−gcgrb−/−/vehicle treated (green), wild-type/rapa treated (white left hashed), and gcgra−/−gcgrb−/−/rapa treated (green left hashed) are shown. ∗p < 0.05 and ∗∗∗p < 0.001 versus wild-type and #p < 0.05 versus vehicle treated; n = 8–11. (I) α cell proliferation in rapa and 10% Gcgr−/− mouse serum co-supplemented media cultured mouse islets. Control RPMI media (#7, Table S4) with no mouse serum added (gray), Gcgr−/− whole mouse serum (with medium combined AA levels plus vehicle)-supplemented media (red), and Gcgr−/− mouse serum and rapa co-supplemented media cultured mouse islets (red left hashed) are shown. ∗∗p < 0.01 versus control media and #p < 0.05 and ##p < 0.01 versus Gcgr−/− mouse serum (with medium combined AA levels plus vehicle)-supplemented media; n = 2–3. (J) α cell proliferation in GCGR mAb-treated FoxP1/2/4−/− mice is shown. Wild-type/PBS treated (white), wild-type/GCGR mAb treated (blue), FoxP1/2/4−/−/PBS treated (white left hashed), and FoxP1/2/4−/−/GCGR mAb treated (blue left hashed) are shown. ∗∗∗p < 0.001 versus PBS treated and ##p < 0.01 versus saline treated; n = 3. (K and L) Quantification of rapa effects on AA-stimulated α cell proliferation (K) and percentage of cells proliferating that are α cells in cultured mouse islets treated for 3 days (L). Highest AA media with DMSO added (black), highest AA media with 30 nM rapa added for the last 24 hr of culture (black left hashed), and highest AA media with 30 nM rapa added for 3 days culture (black right hashed); ∗p < 0.05, ∗∗p < 0.01, and ∗∗∗p < 0.001 versus DMSO treated, and #p < 0.05 versus rapa 24 hr treated; n = 2–3. Data are mean ± SEM. PHENOTYPE:
|
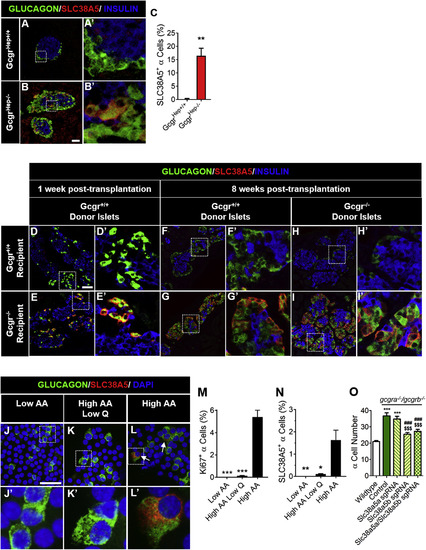
SLC38A5 Is Upregulated in α Cells and Required for Expansion of α Cells in Response to Interrupted Glucagon Signaling (A and B) Representative images of pancreatic islet α cell SLC38A5 expression are shown in (A) control GcgrHep+/+ and (B) GcgrHep−/− mouse pancreas. Glucagon (green), SLC38A5 (red), and insulin (blue) are shown. White scale bars represent 50 μm. White dashed boxes indicate region selected for insets. (C) Quantification of SLC38A5+ α cells in GcgrHep+/+ (white) and GcgrHep−/− (red) mouse pancreas; ∗∗p < 0.01; n = 3. (D–I) Representative images of pancreatic islet α cell SLC38A5 expression in Gcgr+/+ and Gcgr−/− islets from subcapsular renal transplantation into Gcgr+/+ and Gcgr−/− mice (n = 3). SLC38A5 expression is shown at (D and E) 1 week and (F–I) 8 weeks post-transplantation. (J–L) Representative images of pancreatic islet α cell SLC38A5 expression are shown in dispersed islets cultured in in (J) low AA, (K) high AA low Q, or (L) high AA media for 4 days. Glucagon (green), SLC38A5 (red), and DAPI (blue) are shown. White arrows indicate SLC38A5+ α cells. (M and N) Quantification of (M) α cell proliferation and (N) SLC38A5+ α cells in isolated islets cultured in low AA, high AA low Q, or high AA media for 4 days. ∗p < 0.05, ∗∗p < 0.01, and ∗∗∗p < 0.001 versus high AA treated; n = 3. (O) α cell number after knockdown of slc38a5 genes in 6 dpf wild-type (white) and gcgra−/−gcgrb−/− (green, control) zebrafish larvae primary islet. α cell number in slc38a5a single guide RNA (sgRNA)-treated gcgra−/−gcgrb−/− (yellow with green left-hashed), slc38a5b sgRNA-treated gcgra−/−gcgrb−/− (yellow with green right-hashed), or slc38a5a/slc38a5b sgRNA-treated gcgra−/−gcgrb−/− (yellow with green double-hatched) are also shown. ∗∗∗p < 0.001 versus wild-type, ###p < 0.001 versus control gcgra−/−gcgrb−/−, and $$$p < 0.001 versus slc38a5a sgRNA-treated gcgra−/−gcgrb−/−; n = 7–23. Data are mean ± SEM. PHENOTYPE:
|
Reprinted from Cell Metabolism, 25, Dean, E.D., Li, M., Prasad, N., Wisniewski, S.N., Von Deylen, A., Spaeth, J., Maddison, L., Botros, A., Sedgeman, L.R., Bozadjieva, N., Ilkayeva, O., Coldren, A., Poffenberger, G., Shostak, A., Semich, M.C., Aamodt, K.I., Phillips, N., Yan, H., Bernal-Mizrachi, E., Corbin, J.D., Vickers, K.C., Levy, S.E., Dai, C., Newgard, C., Gu, W., Stein, R., Chen, W., Powers, A.C., Interrupted Glucagon Signaling Reveals Hepatic α Cell Axis and Role for L-Glutamine in α Cell Proliferation, 1362-1373.e5, Copyright (2017) with permission from Elsevier. Full text @ Cell Metab.