
- Title
-
Functional Interactions between Newborn and Mature Neurons Leading to Integration into Established Neuronal Circuits
- Authors
- Boulanger-Weill, J., Candat, V., Jouary, A., Romano, S., Pérez-Schuster, V., Sumbre, G.
- Source
- Full text @ Curr. Biol.
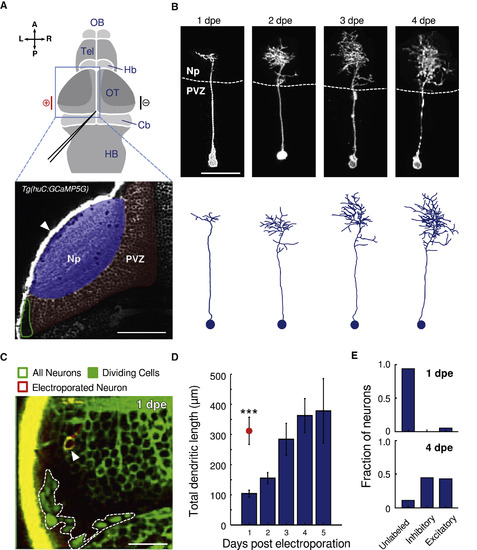
Morphological Development of Newborn Neurons and Emergence of Neurotransmitter Identity (A) Top: schematic dorsal view of the zebrafish brain. The electroporated optic tectum (OT) is indicated by the blue square. The DNA injection capillary scheme is depicted in black. The electroporation electrodes are shown in red (cathode) and black (anode) bars. Cb, cerebellum; Hb, habenula; HB, hindbrain; OB, olfactory bulb; Tel, telencephalon. Bottom: Optical section of a Tg(huC:GCaMP5G) zebrafish larva showing pan-neuronal GCaMP5 expression corresponding to the area in the top scheme (blue rectangle). The periventricular zone (PVZ) of the OT left hemisphere is highlighted in red; Np, neuropil, highlighted in blue. The neurogenesis site is circled in green. The scale bar represents 50 μm. L, left; R, right; A, anterior; P, posterior. (B) Example of a developing newborn-labeled neuron chronically imaged from 1 to 4 dpe. The neuron developed to become a non-stratified peri-ventricular neuron. Bottom: corresponding morphological reconstructions. The scale bar represents 20 μm. (C) An optical section of the tectum’s caudo-lateral region of an electroporated Tg(EF1:mAG-hGem;huC:GCaMP5G) larva (all neurons express GCaMP5G in the cytoplasm and dividing cells express the nuclear localized GFP mAG in the nucleus; dashed line). Note the non-fluorescence region between the dividing cells and the GCaMP5G-expressing neurons. This dark region corresponds to cells that exited the dividing cycle but are not yet neurons. An electroporated newborn neuron can be observed adjacent to the neurogenesis site (imaged at 1 dpe and expressing dTomatoCAAX; arrowhead). The scale bar represents 20 μm. (D) Total dendritic length obtained from morphological reconstructions of newborn neurons from 1 to 5 dpe (n = 22, 17, 10, 12, and 3, respectively). Only one neuron was reconstructed per electroporated larva. The red circle represents the average dendritic length of functionally mature neurons at 1 dpe, n = 8. The error bars represent SEM. ∗∗∗p < 10−3. (E) Fraction of excitatory and inhibitory newborn-labeled neurons in Tg(gad1b:GFP;vglut2a:loxP-DsRed-loxP-GFP) larvae at 1 and 4 dpe. For visualization of the newborn-labeled neurons, a blue fluorescence protein was used for the electroporations (1 dpe: n = 34 neurons from 13 larvae; 4 dpe: n = 62 neurons from 29 larva). See also Figure S1. |
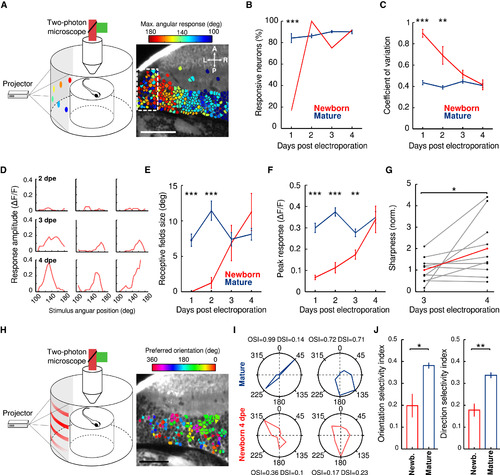
Development of Visually Induced Properties of Newborn-Labeled Neurons (A) Schematic drawing of the recording chamber and the visual stimuli presented to study the visual receptive field of tectal neurons. Examples of light spot stimuli projected on a screen covering a large portion of the larva’s field of view are shown. The light spots are color coded according to their angular position. Right: example of an optical section of the optic tectum showing the functional retinotopic map (note the graded change in colors along the rostro-caudal axis. The neurons are color-coded according to the peak of the neurons’ receptive field. Dashed region indicates the region neighboring the neurogenesis site, containing neurons with weak visual receptive fields and lacking retinotopy organization. Arrows indicate the orientation of the larva: L, left; R, right; A, anterior; P, posterior. The scale bar represents 50 μm. (B) Percentage of visually responsive neurons during development both for newborn (red) and the whole neuronal population (blue) from 1 to 4 dpe (n = 6, 6, 12, and 12 newborn developing neurons and n = 1,883, 2,240, 4,752, and 3,454 neurons from 5, 6, 13, and 10 larvae, respectively). The error bars represent SEM. ∗∗∗p < 0.001. (C) Developmental dynamics of response variability to light spots, quantified as the coefficient of variation, for newborn (blue) and the whole neuronal population (red). The error bars represent SEM. ∗∗∗p < 0.001; ∗∗p < 0.01. (D) Three examples of visual receptive fields (the amplitude of the Ca2+ response with respect to the angular position of the presented light spot within the larva’s field of view), recorded at 2, 3, and 4 dpe. Note the emergence of the receptive fields at 3 dpe. (E and F) Development of the size (E) and peak amplitude (F) of the receptive fields of newborn (red) and whole neuronal population (blue) from 1 to 4 dpe (n = 8 newborn-labeled neurons for each developmental stage and n = 1,565, 2,379, 1,680, and 1,841 functionally mature neurons from 9, 10, 9, and 10 larvae, respectively). The error bars represent SEM. ∗∗∗p < 0.001; ∗∗p < 0.01. (G) Normalized sharpness of the same newborn-labeled neurons imaged at 3 and 4 dpe. Data are normalized to the average value of newborn-labeled neurons at 1 dpe. The red line indicates the average sharpness. ∗p < 0.05. (H) Schematic drawing of the recording chamber and the visual stimuli presented to study the direction and orientation selectivity of tectal neurons. Example of a moving grating projected on a screen covering a large portion of the larva’s field of view. Right: example of an optical section of the optic tectum showing the preferred orientation angle for the direction-selective neurons (direction selectivity index [DSI] > 0.3). Neurons with DSI ≤ 0.3 were not labeled. The scale bar represents 50 μm. (I) Examples of the direction and orientation selectivity (polar plots) of two mature (blue) and two 4-dpe newborn-labeled (red) neurons. The corresponding direction and orientation selectivity indexes (DSI and OSI) are shown above and below the polar graphs. (J) Average of the orientation (left) and direction selectivity (right) indexes for 3- to 4-dpe newborn-labeled (red) and functionally mature (blue) neurons. ∗p < 0.05; ∗∗p < 0.01. The error bars represent SEM. See also Figure S2. |
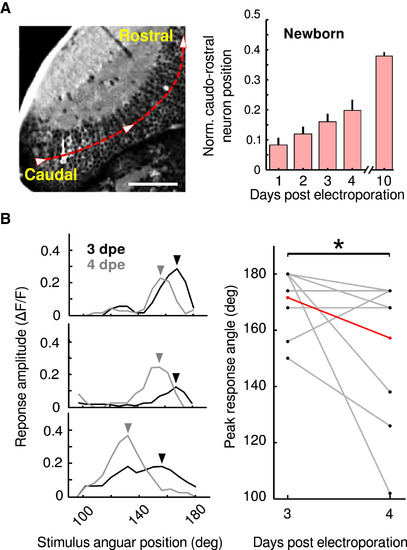
Newborn Neurons Shift the Peak’s Position of Their Receptive Fields as They Develop (A) Left: optical section of the optic tectum of a Tg(huC:GCaMP5G) larva showing the caudo-rostral axis (red). This axis was used for normalization of the position of neurons across recordings. The scale bar represents 50 μm. Right: the average of the normalized caudo-rostral position of newborn-labeled neurons, from 1 to 4 and 10 dpe. Note the gradual displacement of the neurons away from the neurogenesis region. The error bars represent SEM. (B) Left: three examples of the spatial tuning curves of chronically recorded newborn-labeled neurons at 3 (black) and 4 (gray) dpe. Note the displacement of peaks of the tuning curves between 3 and 4 dpe (arrowheads). The displacement is always toward more rostral positions. Right: the angle of the stimulus that generated the strongest responses (peak) at 3 and 4 dpe. Gray lines connect the same newborn-labeled neuron imaged at 3 and 4 dpe. The red line indicates the average of the stimulus’ angle that induced the peak response. ∗p < 0.05. |
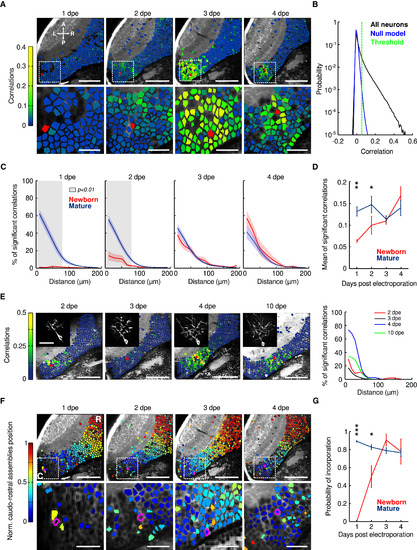
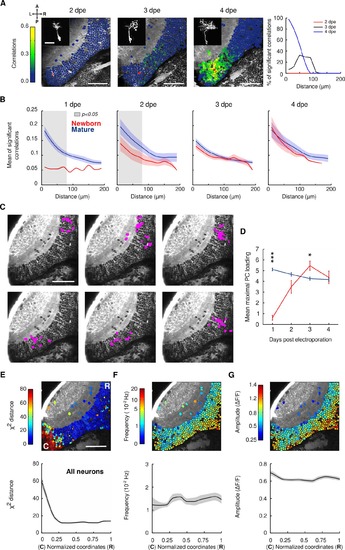
Spontaneous Activity Correlations between Newborn and Functionally Mature Tectal Neurons (A) Top: examples of optical planes of the optic tectum at 1–4 dpe (5–8 dpf). Neurons are color coded according to their pairwise correlation values (color scale bar) with the newborn neuron (red neuron). The scale bars represent 50 μm. Bottom: zoomed image of the dashed areas on top. The scale bars represent 20 μm. Neurons involving few pixels (less than five) or with unstable baselines (rapid changes generally indicating movement artifacts) were left unlabeled. L, left; R, right; A, anterior; P, posterior. (B) Probability density for the correlations between the newborn-labeled and the functionally mature neurons. Black, the pairwise correlations; blue, the corresponding null model. The null model was used to determine significant correlations (threshold: p < 0.01; dashed green line). (C) The developmental dynamics of the relationship between the percentage of significant correlations and the physical distance between the neurons for the newborn-labeled neurons (red) and the functionally mature neurons (blue) from 1 to 4 dpe. Confidence intervals show SEM. Gray shaded areas indicate significant differences between newborn and functionally mature curves (p < 0.01; Mann-Whitney U test). (D) The developmental dynamics of the average of the significant correlations between newborn-labeled neurons and the rest of the tectal neurons (red) and the significant correlations between the functionally mature neurons (blue). ∗p < 0.05; ∗∗p < 0.01. The error bars represent SEM. (E) Left: example of the same newborn-labeled neuron chronically imaged at 2, 3, 4, and 10 dpe. Tectal neurons are color coded according to their pairwise correlation values with the newborn-labeled neuron (red). The scale bars represent 50 μm. Note their displacement away from the unlabeled neurogenesis region. Insets represent the morphology of the labeled neuron. The scale bar represents 20 μm. Right: relationship between the significant correlations between the newborn-labeled neuron with the rest of the imaged tectal neurons and the physical distance between the neurons for each imaged developmental stage (2, 3, 4, and 10 dpe). (F) Top: developmental dynamics of the incorporation of newborn-labeled neurons into neuronal tectal assemblies. The tectal neurons are color coded according to the assembly they belong to (the position of the assembly along the caudo-rostral tectal axis). The newborn-labeled neuron is colored in magenta. The scale bars represent 50 μm. Bottom: zoom of the dashed areas in the top panel. The newborn-labeled neuron is circled in magenta. Note that, only at 3 dpe, the newborn-labeled neuron is also colored in blue, indicating that it is part of one of the assemblies. Neurons involving few pixels (less than five) or with unstable baselines (rapid changes generally indicating movement artifacts) were left unlabeled. The scale bars represent 20 μm. (G) Probability of incorporation of newborn-labeled neurons into the neuronal assemblies (red) and the probability of the functionally mature neurons to belong to one of the neuronal assemblies (blue) for 1–4 dpe (newborn neurons: n = 6, 15, 21, and 15; functionally mature neurons: n = 1,962, 3,564, 5,296, and 3,969 from 6, 10, 17, and 11 larvae, respectively). ∗p < 0.05; ∗∗∗p < 0.001. The error bars represent SEM. See also Figure S3. |
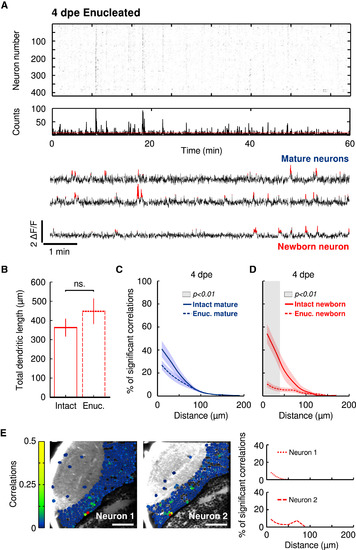
Retinal Inputs Are Necessary for the Proper Integration of Newborn Neurons into Functionally Mature Sub-circuits (A) Top: Representative raster plot of significant spontaneous Ca2+ transients, revealing episodes of synchronous activations at 4 dpe (8 dpf) in enucleated conditions. Middle: histogram of the raster. The red line indicates the threshold for significant population events. Bottom: representative traces of mature (top traces) and newborn neurons (bottom trace). Significant ΔF/F transients are highlighted in red. (B) Average of the total dendritic length of newborn-labeled neurons in intact (solid box) and enucleated (dashed box) 4-dpe larvae. ns, non-significant. The error bars represent SEM. (C) The relationship between the percentage of significant correlations among functionally mature neurons in enucleated (dashed line) and intact (solid line) larvae and the physical distance between the neurons. Note that the two curves are not significantly different. (D) The same as (C), but for the correlations between newborn-labeled neurons and the rest of the tectal neurons. Note the significant difference between the two curves for short distances. The gray shaded area indicates the significant difference between the curves (p < 0.01; Mann-Whitney U test). Confidence intervals show the SEM. (E) Two examples of the pairwise correlations between newborn-labeled and the rest of the tectal neurons at 4 dpe. Left: optical sections of the optic tectum with neurons color coded (color scale bar) according to their pairwise correlations with the newborn-labeled neuron (red). Right: the relationship between the percentage of significant correlations between the newborn-labeled neuron and the rest of the tectal neurons and the physical distance between them for the two examples on the left. Note the inability of the newborn-labeled neurons to incorporate into the tectal circuit in enucleated larvae. Neurons involving few pixels (less than five) or with unstable baselines (rapid changes generally indicating movement artifacts) were left unlabeled. See also Figure S4 and Table S1. |

Related to Figure 1. Morphological development and emergence of neurotransmitter identity of newborn neurons (A) Picture of the electroporation preparation with the electrodes positioned on both sides of the larva. White arrow: the capillary containing DNA introduced in the tectal ventricle. Scale bar: 200 μm. (B) i, DNA constructs used for labeling newborn neurons in Tg(huC:GCaMP5G). Long-term expression of the vectors was achieved using the co-electroporation of a transposase enabling the stable incorporation of the constructs flanked with Tol2 sites, into the larva’s genome. ii; Constructs used for labeling newborn neurons in Tg(gad1b:GFP;vglut2a:loxP-DsRed-loxP-GFP). (C) Quantification of the survival of electroporated larvae and age-matched controls, at 1 and 7 dpe. Note that electroporations did not show any significant effect in the survival of the larvae. ns.: p > 0.05. (D) Time-course of the zebrafish larva development from 0 to 8 dpf, in terms of morphology, behavior and maturation of the visual system. Performing electroporations at 4 dpf enables studying the development of newborn neurons as they incorporate into an already functionally mature brain structure. OKR: optokinetic response and OMR: opto-motor response. Red dots: the developmental stages at which we performed the experiments. Arrow-head: the developmental stage at which we performed the electroporations. (E) Two examples of mature neurons in 5 dpf larvae (i and ii). Left, position of the soma of the labeled neuron (arrow-head), within the PVZ layer of the optic tectum. Scale bar: 50 μm. Middle, a 3D projection of the mature neuron showing the neuron’s morphology. Scale bar: 20 μm. Right, reconstruction of the neuron in the middle panel. Note that in contrast to the newborn-labeled neurons at 5 dpf (1 dpe), neurons far from the neurogenesis site already show mature morphologies. The neurons were labeled using single-cell electroporation in Tg(huC:GCaMP5) larvae. (F) Examples of Tg(gad1b:GFP;vglut2a:loxP-DsRed-loxP-GFP) larvae electroporated with Tol2- huC:Gal4 and Tol2-10xUAS:mTagBFP2CAAX constructs. Electroporated newborn neurons are indicated with white arrow-heads. Top, a newborn neuron not yet differentiated at 1 dpe. Middle and bottom, differentiated excitatory and inhibitory neurons at 4 dpe. First column: optical plane of the optic tectum showing inhibitory (green), excitatory (red) neurons and a single newborn neuron (blue and arrow-head). Scale bars: 20 μm. Second, third and fourth columns, zoom of the dashed region in the first column, for the red, green and blue channels, respectively. Fifth column, all channels merged. Scale bars: 50 μm. L: left, R: right, A: anterior and P: posterior. (G) Based on the morphology of the dendritic arbors at 4 dpe, newborn-labeled neurons developed into different neuronal types. Fraction of the different neuronal types. nsPVIN: non-stratified periventricular interneurons. PVPN: periventricular projection neurons. bsPVIN : bi-stratified periventricular interneurons. |

Related to Figure 2. Development of functional intrinsic and visually induced properties of newborn neurons (A) Development dynamics of the coefficient of variation of neuronal responses to drifting gratings, for newborn-labeled (red) and mature (blue) neurons (newborn-labeled neurons: n=7, 10, 6 and 3, for 1-4 dpe, respectively; mature neurons: n=973, 1340, 858 and 453 mature neurons, from 5, 7, 4 and 2 larvae). **: p < 0.01. Error bars: SEM (B-D) Top, example of an optical plane of the optic tectum with neurons color-coded according to their coefficient of variation (B), orientation (C) and direction-selectivity index (D). Magenta: poorly responsive neurons (in C-D, p>0.01, Mann-Whitney U tests or silent neurons in B). Note that these neurons were mainly clustered in close vicinity of the neurogenesis region (dashed area). Neurons with noisy baseline were left unlabeled. Arrows: orientation of the larva: L: left, R: right, A: anterior and P: posterior. Scale bar: 50 μm. Bottom, averaged distributions of the measured parameters on top, across the normalized coordinates along the caudo-rostral axis (white dashed curve on top, C: caudal, R: rostral), for all neurons, from 5 to 8 dpf (n=5046 neurons, from 18 larvae). Confidence interval: SEM. Changes in the orientation-, direction-selectivity index and coefficient of variation were significant across the caudo-rostral axis (p=7.61x10⁻²⁰, p=4.29x10⁻²³ and p=4.57x10⁻³³, respectively, Kruskal-Wallis tests). Note the large differences for the three measured parameters close to the neurogenesis region (dashed region). Neurons involving few pixels (less than 5) or with unstable baselines (rapid changes generally indicating movement artifacts) were left unlabeled. |
Rrelated to Figure 5. Spontaneous activity correlations between newborn-labeled and mature tectal neurons (A) Left, example of an optical plane of the optic tectum containing a newborn-labeled neuron (red) chronically imaged from 2 to 4 dpe. Neurons are color-coded according to their pair-wise correlation values with the newborn-labeled neuron. Color scale bar: Pair-wise correlations between the newborn-labeled neuron and the rest of the tectal neurons. Scale bars: 50 μm. Insets: Morphology of the newborn-labeled neuron. Scale bars: 20 μm. Right, the percentage of significant correlations between the developing newborn-labeled neurons and the rest of the tectal cells, with respect to the physical distance between the neurons, for 2 (red), 3 (black) and 4 (blue) dpe. Neurons involving few pixels (less than 5) or with unstable baselines (rapid changes generally indicating movement artifacts) were left unlabeled. (B) The developmental dynamics of the relationship between the mean of significant correlations and the physical distance between the neurons, for the newborn-labeled neurons (red) and the mature neurons (blue), from 1 to 4 dpe. Confidence intervals: SEM. Gray shaded areas: significant differences between newborn and mature curves (p<0.05, Mann-Whitney U tests). (C) Examples of 6 spontaneous neuronal assemblies showing their topographies. Magenta: neurons within an assembly. (D) The maximal principal component loadings for newborn-labeled and mature neurons. Maximal principal component loadings reflect the level of prediction of the activity of a neuron by the activity of the assembly which contains it, assuming that each neuron belongs only to one assembly. *: p<0.05. ***: p<0.001. Error bars: S.E.M, newborn neurons: n= 6, 15, 21, 15; mature neurons: n=1962, 3564, 5296, 3969, from 6, 10, 17 and 11 larvae, respectively. (E-G) Top, example of an optical section of the optic tectum showing neurons color-coded according to X2 distance (high values indicate low level of significant correlations), the frequency of the spontaneous Ca2+ events (middle), and the amplitude of the spontaneous Ca2+ events (right). The X2 distance is the euclidean distance between the average distribution represented in Figure 5C (mature neurons, blue curve) and the distribution of each neuron, for distances shorter than 60μm. High X2 values indicate neurons that are isolated from others (do not show significant correlations with other neurons). Bottom, averaged distributions of the measured parameters, across the normalized coordinates along the caudo-rostral axis, for all neurons, from 5 to 8 dpf (n=17678 neurons, from 44 larvae). Confidence interval: SEM. Changes in the X2 distance across the caudorostral axis were significant, while the frequency and amplitude of the spontaneous Ca2+ events did not show significant changes (p=4.12x10⁻⁶, p=0.55 and p=0.26, respectively, Kruskal-Wallis tests). Neurons involving few pixels (< 5) or with unstable baselines (rapid changes generally indicating movement artifacts) were left unlabeled. |

Related to Figure 6. Enucleations prevent neurons from newborn neurons from incorporation into the mature tectal circuit but do not affect the development of their morphology. (A) Two examples of the morphology of newborn-labeled neurons at 4 dpe after when enucleations were performed at 3.5 dpf. Left, a projection of the newborn-labeled neuron showing the developed dendritic morphology. Scale bar: 20 μm. Right, reconstruction of the neuron on the left. (B) Top, the percentage of significant correlations with respect to the distance between neurons, at three different regions of the optic tectum (caudal, medial and rostral along the caudo-rostral tectal axis), at 4 dpe, for intact (solid line) and enucleated (dashed line) larvae. Bottom, an example of an optical section of the optic tectum showing the neurons (magenta) belonging to the three tectal regions (caudal: 0-0.2, medial 0.2-0.4, rostral: 0.4.0.6) used for the analyses in the top panel. |