
- Title
-
The zebrafish ventricle: A hub of cardiac endothelial cells for in vitro cell behavior studies
- Authors
- Patra, C., Kontarakis, Z., Kaur, H., Rayrikar, A., Mukherjee, D., Stainier, D.Y.R.
- Source
- Full text @ Sci. Rep.
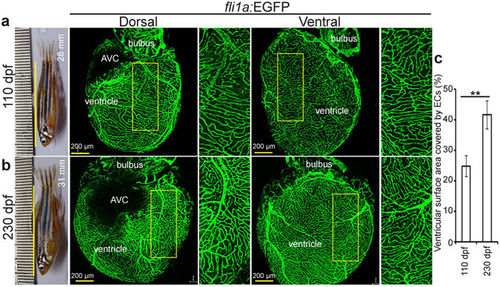
Zebrafish coronary vessels continue to grow after 3 months post fertilization. (a,b) Representative brightfield images of adult zebrafish and maximum intensity projections of confocal images of freshly isolated hearts from 110 (a) and 230 (b) dpf Tg(fli1a:EGFP) animals. Green cells have pan-endothelial identity. (c) Quantification of cardiac ventricular surface area covered by endothelial cells (n = 3 of each stage, mean ± SEM). One way ANOVA followed by Bonferroni’s post-hoc test (GraphPad Prism) was performed to evaluate statistical significance of differences. P < 0.05 was considered statistically significant. ** corresponds to P < 0.05. AVC- atrioventricular canal, dpf- days post fertilization. |
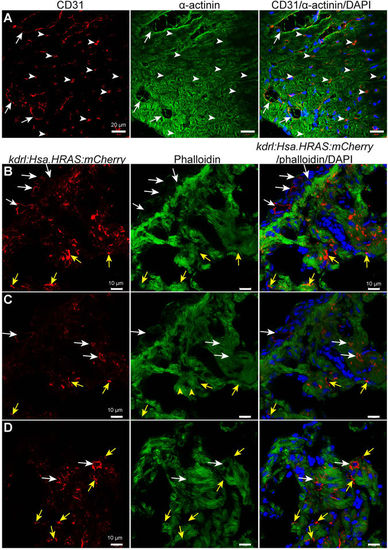
Endothelial cell distribution in 8 months old mouse and zebrafish ventricles. (A) Representative confocal images of sagittal cryosections through 8 months old mouse hearts stained for α-actinin (green; marking cardiomyocytes), CD31 (red; marking the cell membrane of endothelial cells) and DAPI (blue, staining the nuclei). White arrows and arrowheads point to bigger coronary vessels (visible lumen) and capillaries (lumen not visible) in cardiac tissue, respectively. (B–D) Representative confocal images of sagittal cryosections through 8 mpf Tg(kdrl:Hsa.HRAS-mCherry) zebrafish hearts stained for phalloidin (green; marking cardiac tissue), mCherry (red; marking the cell membrane of endothelial cells) and DAPI (blue; staining the nuclei). White arrows point to bigger coronary vessels (visible lumen). Yellow arrows point to endocardial cells in the cardiac tissue. ‘B’ and ‘C’ images show different optical planes of the same tissue section. |

Culture of ventricular endothelial cells isolated from adult Tg(kdrl:EGFP) zebrafish. (a–b) Brightfield and fluorescence images of cultured cells (60 h after seeding) on a fibronectin coated culture dish without a preplating step (a) or after a 4 h preplating step (b). Black arrowheads, non-endothelial cells; BF- Brightfield. (c) Example of brightfield and fluorescence images (green for EGFP positive endothelial cells, and blue for nuclei (Hoechst 33342)) of isolated live ventricular cells on the preplate, after 4 h preplating. (d) Example of cultured cardiac endothelial cells after 1st passage, stained for EGFP (green), rhodamine phalloidin (all cell types, red), and DAPI (nuclei, blue). (e) Quantification of endothelial cells to total cells after 1st passage, showing high purity of the cultures. (n = 3, mean ± SEM). (f) RT-qPCR analysis using cardiomyocyte (myl7), fibroblast (vim), smooth muscle cell (acta2), epicardial (wt1b), and endothelial (kdr) markers (n = 3, mean ± SEM). Marker gene mRNA expression levels relative to α-tubulin were calculated using the ΔCt method (ct values are indicated in the Supplemental Table 2). Expression is relative to the individual marker’s expression in whole cardiac ventricles. All non-endothelial markers, besides wt1b, are depleted in the isolated cell population. Concomitantly, the isolated cells show enrichment for the endothelial marker kdr. One way ANOVA followed by Bonferroni’s post-hoc test (GraphPad Prism) was performed to evaluate statistical significance of differences. P < 0.05 was considered statistically significant. *** corresponds to P < 0.001. |

Cardiac endothelial cells proliferate in vitro. 24 h after seeding, ECs were cultured in EGM2 medium supplemented with 0, 0.5 or 10% FBS for 12 h and then analyzed for DNA synthesis using a 12 h pulse of EdU. (a) Representative images of endothelial cells stained for EGFP (green), EdU (red), and DAPI (nuclei, blue). White arrowheads point to EdU-positive endothelial cells. (b) Quantification of EdU+ EGFP+ endothelial cells without or with FBS in the culture medium (n = 3, mean ± SEM). P < 0.05 was considered statistically significant. (c) Example of cell density experiments. Cells were cultured with 10% FBS, resulting in endothelial cell proliferation. Plus and asterisk symbols are depicting landmarks, showing that pictures were taken from the same region for the cell density analysis. Yellow frames indicate areas of analysis. (d) Quantitative analysis of endothelial cell number increment in 24 h (n = 3, mean ± SEM). One way ANOVA followed by Bonferroni’s post-hoc test (GraphPad Prism) was performed to evaluate statistical significance of differences. P < 0.05 was considered statistically significant. ** corresponds to P < 0.05. |

Scratch/wound-healing assay on cardiac endothelial cells. Assay was performed on isolated cardiac endothelial cells from adult Tg(kdrl:EGFP) zebrafish ventricles. (a) Fluorescence and brightfield images at 4 and 16 h after scratching. (b) Quantification of the initial cell free area covered by endothelial cell migration in 12 h. Cell free area at 4 h after scratch was considered as 100% (n = 3, mean ± SEM). One way ANOVA followed by Bonferroni’s post-hoc test (GraphPad Prism) was performed to evaluate statistical significance of differences. P < 0.05 was considered statistically significant. *** corresponds to P < 0.001. |
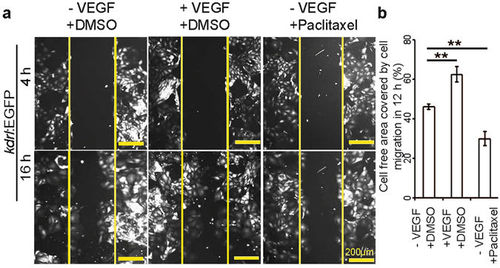
The migratory behavior of cardiac endothelial cells can be regulated by small molecule and growth factor treatment. (a) Fluorescence images at 4 and 16 h after scratching in the presence or absence of VEGF or Paclitaxel as indicated. (b) Quantitative analysis of the relative cell free area covered by endothelial cell migration in 12 h. Control cells were treated with DMSO, and in all cases, cell free area at 4 h after scratch was considered as 100% (n = 3, mean ± SEM). One way ANOVA followed by Bonferroni’s post-hoc test (GraphPad Prism) was performed to evaluate statistical significance of differences. P < 0.05 was considered statistically significant. ** corresponds to P < 0.05. |

Cardiac endothelial cells are proliferative in vivo. (a) Representative views of maximum confocal projections through 6 months old Tg(fli1a:EGFP) zebrafish whole mount hearts stained for EGFP (green), EdU (red), and DAPI (nuclei, blue). (b-d) Representative confocal images of ‘a’. Arrowheads point to EdU+ EGFP+ cells. (e) Quantification of EdU/EGFP-positive coronary endothelial cells. (n=4). (f) Representative views of cultured endothelial cells stained for EGFP (green), EdU (red), and DAPI (nuclei, blue). White arrowheads point to EdU-positive endothelial cells. (g) Quantification of EdU+ EGFP+ endothelial cells with 10% FBS in culture medium (n=3, mean±SEM). |
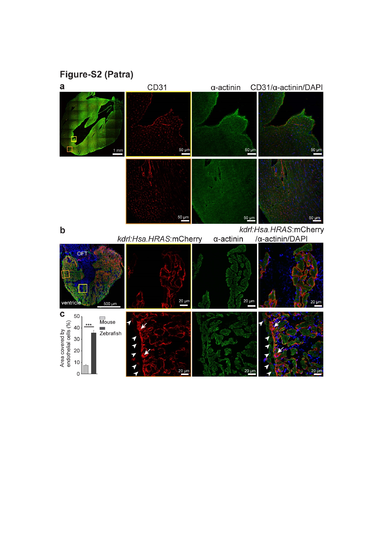
Endothelial cell density in 8 months old mouse and zebrafish ventricles. (a) Representative confocal images of sagittal cryosections through 8 months old mouse hearts stained for α-actinin (green; marking cardiomyocytes), CD31 (red; marking the cell membrane of endothelial cells) and DAPI (blue; staining the nuclei). (b) Representative confocal images of sagittal cryosections through 8 mpf Tg(kdrl:Hsa.HRAS-mCherry) zebrafish hearts stained for α-actinin (green; marking cardiomyocytes), mCherry (red; marking endothelial cell membrane) and DAPI (blue; staining the nuclei). White arrowheads point to bigger coronary vessels in the outer compact layer; white arrows point to dense capillaries in the inner compact layer. (c) Quantification of the area covered by endothelial cells (as percentage of total cardiac tissue area). 10 sections from each heart from three zebrafish and three mice were analyzed (mean±SEM). One way ANOVA followed by Bonferroni’s post-hoc test (GraphPad Prism) was performed to evaluate statistical significance of differences. p < 0.05 was considered statistically significant. *** corresponds to P<0.001. |

Cardiac ventricular endothelial cells in culture. Brightfield (BF) and fluorescence images of cardiac ventricular ECs after 58 h in culture; cell isolate was seeded on fibronectin coated cell culture dishes. White arrowheads point to ECs. |
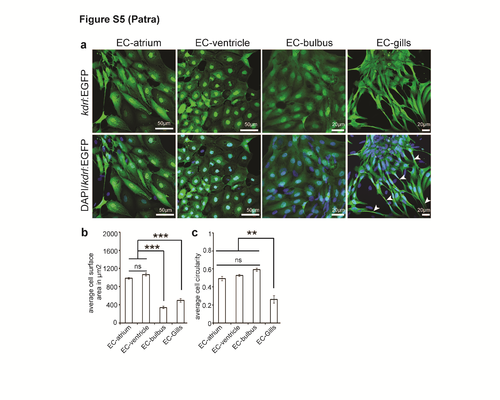
Morphological diversity of endothelial cells from different tissues. Cultured endothelial cells isolated from ventricle, atrium, bulbus arteriosus and gills. (a) Cells were stained for EGFP (endothelial cells, green), and DAPI (nuclei, blue) 2 days post seeding. White arrowheads point to elongated endothelial cells. (b, c) Quantitative analysis of the average surface area and average circularity of individual endothelial cells of different origins (n=3, mean±SEM). One way ANOVA followed by Bonferroni’s post-hoc test (GraphPad Prism) was performed to evaluate statistical significance of differences. P< 0.05 was considered statistically significant. *** corresponds to P<0.001 and ** corresponds to P<0.05. |